

Gold, silver, and crude oil markets are currently under pressure due to shifting sentiment surrounding US-China trade relations and a stronger US Dollar. While gold struggles below $3,300, silver has dropped below $33, and WTI crude oil remains capped below $63. Meanwhile, natural gas shows potential signs of a breakout from its multi-week downward channel.
KEY HIGHLIGHTS
- Gold remains under pressure amid US-China trade optimism.
- Silver weakens as safe-haven demand continues declining.
- Crude Oil struggles with limited gains and selling pressure.
- Natural Gas nears breakout after prolonged downward channel
Markets in Focus Today
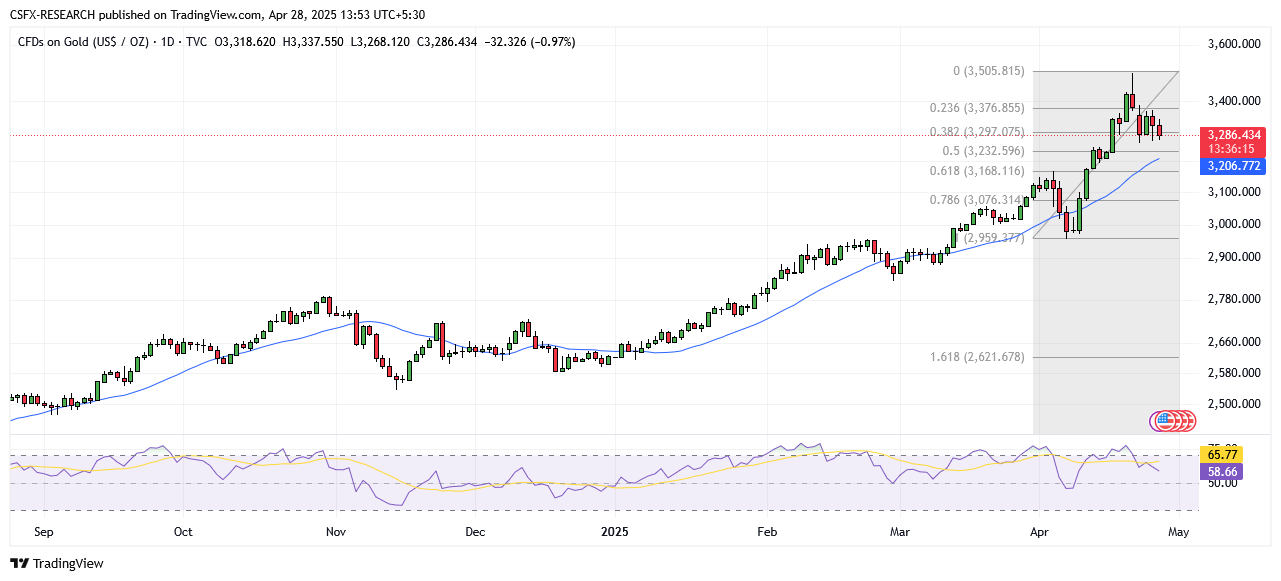
Gold (XAU/USD): Gold Under Pressure Below $3,300 Amid Trade Optimism
Fundamental Overview
Gold prices remain under pressure, trading below the $3,300 level as early European session trading begins. Key drivers include:
- US-China Trade Developments: Growing optimism over a potential US-China trade deal is weighing on safe-haven demand.
- US Dollar Strength: A modest rebound in the US Dollar is further pressuring gold prices.
- China’s Gold Consumption: A reported decline in China’s gold consumption during Q1 2025 is also a bearish factor.
- Federal Reserve Outlook: Expectations of aggressive policy easing by the Fed could curb the USD’s recovery and offer some support to gold.
- Geopolitical Risks: Shifting US trade policies and ongoing geopolitical tensions could bolster gold’s safe-haven appeal, limiting deeper losses.
Technical Overview

Moving Averages
- Exponential Moving Averages:
- MA 10: 3291.1330 | Negative Crossover | Bearish
- MA 20: 3225.1185 | Positive Crossover | Bullish
- MA 50: 3085.3549 | Positive Crossover | Bullish
- Simple Moving Averages:
- MA 10: 3315.1507 | Negative Crossover | Bearish
- MA 20: 3206.7356 | Positive Crossover | Bullish
- MA 50: 3057.8306 | Positive Crossover | Bullish
Indicators
- RSI (Relative Strength Index): 58.7056 | Buy Zone | Bullish
- Stochastic Oscillator: 66.1182 | Buy Zone | Neutral
Resistance and Support Levels
- Resistance 1 (R1): 3139.5072
- Resistance 2 (R2): 3203.7148
- Support 1 (S1): 2931.6488
- Support 2 (S2): 2867.4412
Market Sentiment and Direction
- Overall Sentiment: Bullish
- Market Direction: Buy
Trade Suggestion
- Entry: Limit Buy at 3252.00
- Take Profit: 3383.50
- Stop Loss: 3177.45
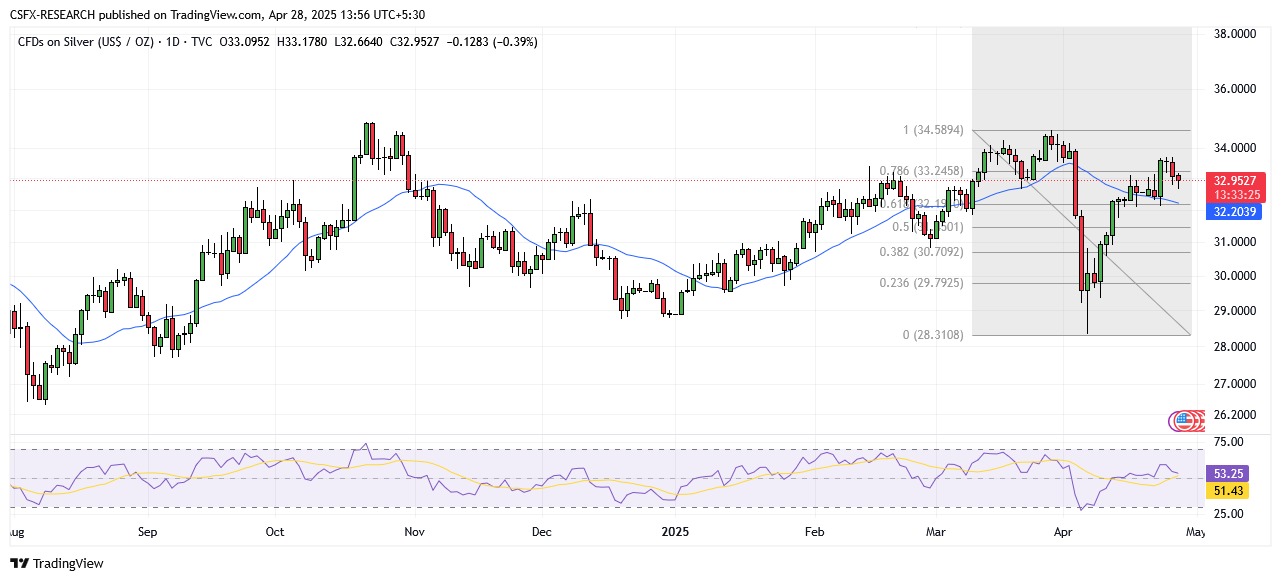
Silver (XAG/USD): Silver Drops Below $33 as Safe-Haven Demand Fades
Fundamental Overview
Silver prices continue to decline, trading around $32.80 per troy ounce during the Asian session. Key factors include:
- US-China Trade Optimism: Easing tensions diminish safe-haven appeal.
- Tariff Reductions: China exempted some US imports from tariffs, signaling progress in trade talks.
- Stronger US Dollar: A rising DXY index, nearing 99.70, adds pressure to silver prices.
- Upcoming US Data: Markets await key US economic releases, including Q1 GDP, PCE inflation, and employment data.
Technical Overview
Moving Averages
- Exponential Moving Averages:
- MA 10: 32.80 | Positive Crossover | Bullish
- MA 20: 32.26 | Positive Crossover | Bullish
- MA 50: 31.60 | Positive Crossover | Bullish
- Simple Moving Averages:
- MA 10: 32.78 | Positive Crossover | Bullish
- MA 20: 32.61 | Positive Crossover | Bullish
- MA 50: 31.90 | Positive Crossover | Bullish
Indicators
- RSI (Relative Strength Index): 53.03 | Buy Zone | Bullish
- Stochastic Oscillator: 87.51 | Buy Zone | Neutral
Resistance and Support Levels
- Resistance 1 (R1): 33.53
- Resistance 2 (R2): 34.56
- Support 1 (S1): 32.27
- Support 2 (S2): 31.08
Market Sentiment and Direction
- Overall Sentiment: Bullish
- Market Direction: Buy
Trade Suggestion
- Entry: Limit Buy at 32.65
- Take Profit: 33.27
- Stop Loss: 32.33
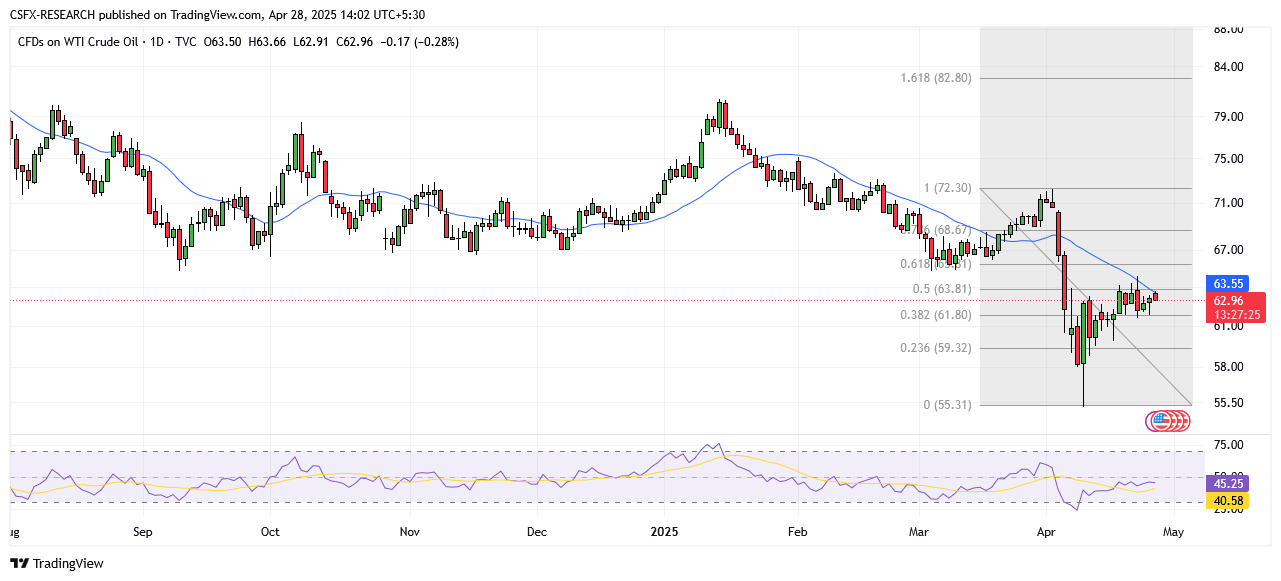
Crude Oil (WTI): Crude Oil Struggles Around $62.90 Amid Uncertainty
Fundamental Overview
WTI crude oil is experiencing mild losses, trading near $62.65 during the Asian session. Main influences:
- Trade Deal Uncertainty: Lack of clarity on US-China talks limits optimism.
- Global Demand Concerns: Fears of a global recession continue to impact fuel demand forecasts.
- OPEC+ Production Plans: Expected increases in output pressure crude prices.
- Geopolitical Tensions: Ongoing Russia-Ukraine conflict and related political developments support crude prices, limiting downside risks.
Technical Overview
Moving Averages
- Exponential Moving Averages:
- MA 10: 63.0109 | Positive Crossover | Bullish
- MA 20: 63.8176 | Negative Crossover | Bearish
- MA 50: 66.2371 | Negative Crossover | Bearish
- Simple Moving Averages:
- MA 10: 62.8117 | Positive Crossover | Bullish
- MA 20: 63.6981 | Negative Crossover | Bearish
- MA 50: 66.7296 | Negative Crossover | Bearish
Indicators
- RSI (Relative Strength Index): 44.9734 | Neutral Zone | Neutral
- Stochastic Oscillator: 76.2800 | Buy Zone | Neutral
Resistance and Support Levels
- Resistance 1 (R1): 71.9971
- Resistance 2 (R2): 73.5573
- Support 1 (S1): 66.9463
- Support 2 (S2): 65.3861
Market Sentiment and Direction
- Overall Sentiment: Bearish
- Market Direction: Sell
Trade Suggestion
- Entry: Limit Sell at 64.70
- Take Profit: 59.86
- Stop Loss: 68.56
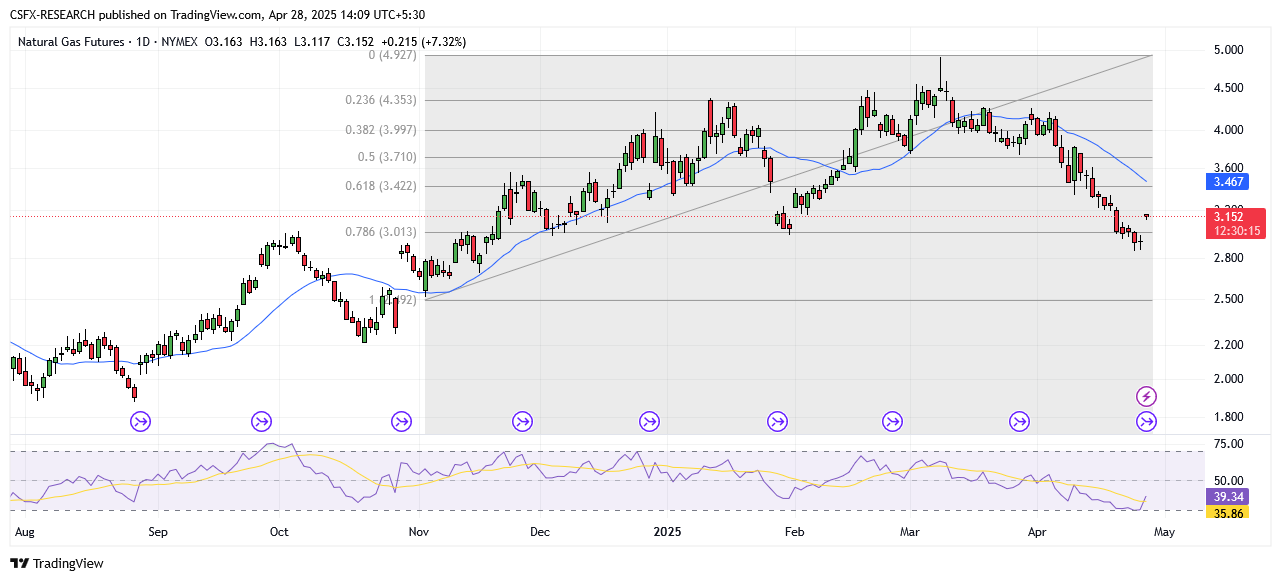
Natural Gas: Natural Gas Tests $3.165 Resistance, Breakout Potential
Fundamental Overview
Natural gas prices are testing key resistance around $3.165, suggesting a possible breakout from their recent downward channel. Highlights:
- Immediate Resistance: $3.165, followed by $3.253 and $3.342.
- Immediate Support: $3.047, $2.966, and $2.880.
- Technical Outlook: The 50 EMA at $3.178 is capping upward movement, while the 200 EMA at $3.514 reinforces the broader bearish trend.
- Breakout Potential: A decisive move above $3.165 could trigger a short squeeze, while failure could send prices back toward $3.047.
Technical Overview
Moving Averages
- Exponential Moving Averages:
- MA 10: 3.1682 | Negative Crossover | Bearish
- MA 20: 3.3794 | Negative Crossover | Bearish
- MA 50: 3.6332 | Negative Crossover | Bearish
- Simple Moving Averages:
- MA 10: 3.1395 | Negative Crossover | Bearish
- MA 20: 3.4600 | Negative Crossover | Bearish
- MA 50: 3.8764 | Negative Crossover | Bearish
Indicators
- RSI (Relative Strength Index): 31.9047 | Neutral Zone | Neutral
- Stochastic Oscillator: 12.8171 | Neutral Zone | Neutral
Resistance and Support Levels
- Resistance 1 (R1): 4.7739
- Resistance 2 (R2): 5.0791
- Support 1 (S1): 3.7861
- Support 2 (S2): 3.4809
Market Sentiment and Direction
- Overall Sentiment: Bearish
- Market Direction: Sell
Trade Suggestion
- Entry: Limit Sell at 3.17
- Take Profit: 2.98
- Stop Loss: 3.30
Elsewhere in the Commodity Market
- Gold: Down 1.11% at 3282.92
- Silver: Down 0.34% at 32.92
- Palladium: Up 0.99% at 949.01
- Platinum: Up 0.20% at 974.42
- Brent Crude Oil: Down 0.21% at 65.72
- WTI Crude Oil: Down 0.26% at 62.96
Key Economic Events and Data Releases Today
- (CAD) Wholesale Sales (MoM) (March): Previous 0.3% at 17:30