

Gold and silver prices are experiencing downward pressure as the US Dollar strengthens, though market uncertainties and geopolitical risks provide some support. Meanwhile, crude oil remains stable, driven by US sanctions on Iran and OPEC+ production cuts. Natural gas futures are testing key resistance levels, with storage data and weather forecasts influencing price movements.
KEY HIGHLIGHTS
- Gold Declines as Stronger US Dollar Weakens Momentum.
- Silver Faces Selling Pressure, Tests Critical Support Levels.
- WTI Oil Maintains Stability Amid US-Iran Sanctions.
- Natural Gas Tests Key Resistance Ahead of Storage Data.
Market in Focus Today – GOLD (XAU/USD)
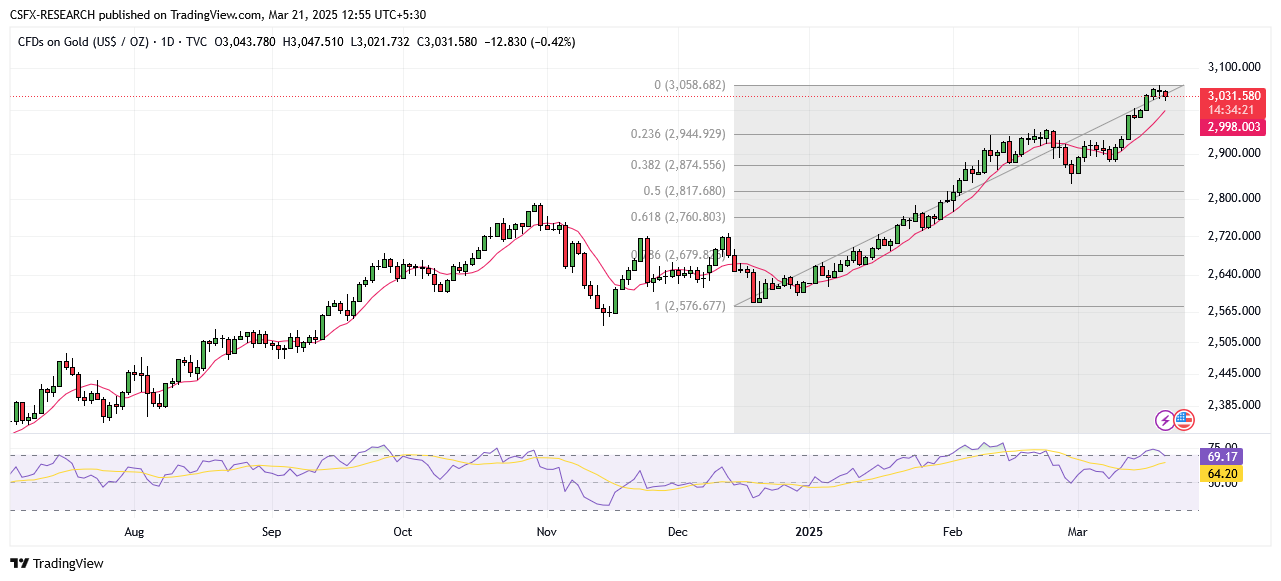
Gold prices remain near a multi-day low as the strong US Dollar exerts pressure. However, bearish momentum is limited due to ongoing trade uncertainties and expectations that the Federal Reserve may resume rate cuts.
Key Market Insights:
- Gold continues to decline for the second consecutive day, briefly recovering from a three-day low of $3,020.
- The US Dollar gains traction following the Fed’s forecast of only two 25-basis-point (bps) rate cuts by year-end.
- Profit-taking ahead of the weekend also contributes to price declines.
- Uncertainty over US President Donald Trump’s trade policies and ongoing geopolitical risks provide support for the metal.
Technical Overview

Moving Averages:
- Exponential: MA 10: 2997.24 | Bullish | Positive Crossover
- Simple: MA 10: 2986.46 | Bullish | Positive Crossover
Indicators:
- RSI (Relative Strength Index): 68.54 | Bullish | Buy Zone
- Stochastic Oscillator: 91.47 | Neutral | Buy Zone
Key Levels:
- Resistance: R1: 2932.05 | R2: 2975.46
- Support: S1: 2791.51 | S2: 2748.10
Trade Suggestion:
- Limit Buy: 3000.00
- Take Profit: 3050.00
- Stop Loss: 2670.00
Silver (XAG/USD) Struggles Near Weekly Low
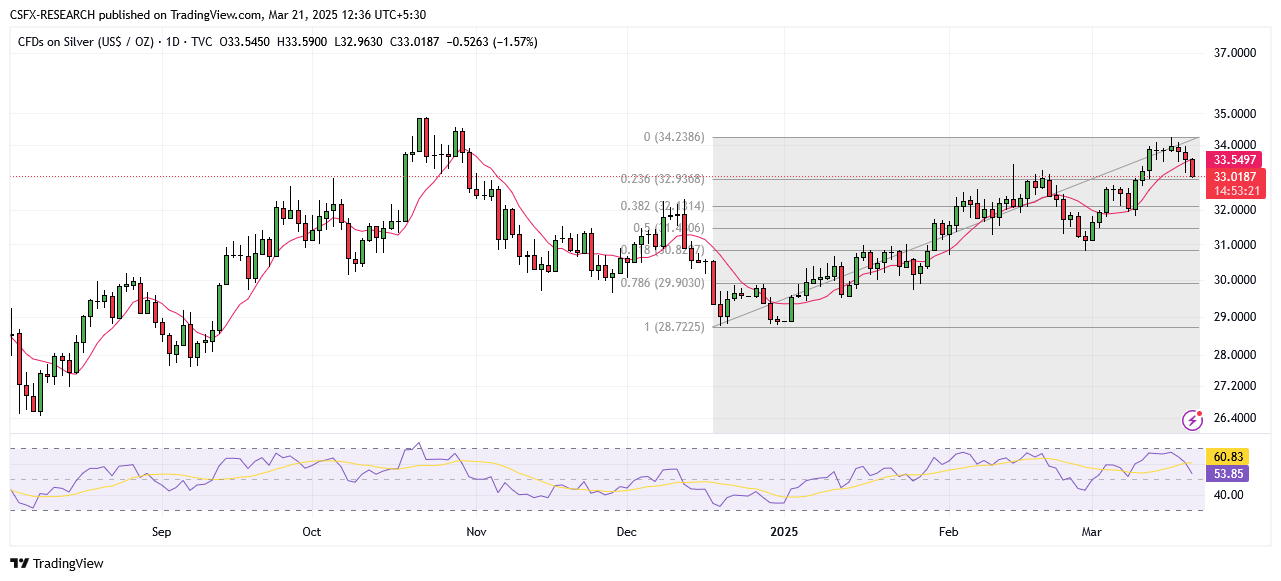
Silver prices remain under pressure, hovering just above the $33.00 level as bearish momentum extends into a third consecutive day.
Key Market Insights:
- Silver is testing the 23.6% Fibonacci retracement level, indicating potential for further declines.
- The 38.2% Fibonacci support level at $32.90 could prevent further losses.
- A break below $32.50 may confirm a short-term top for silver.
- A sustained move above $33.55 may push XAG/USD towards a multi-month high of $34.20-$34.25.
Technical Overview
Moving Averages:
- Exponential: MA 10: 33.37 | Bearish | Negative Crossover
- Simple: MA 10: 33.30 | Bearish | Negative Crossover
Indicators:
- RSI: 55.01 | Bullish | Buy Zone
- Stochastic Oscillator: 59.45 | Neutral | Buy Zone
Key Levels:
- Resistance: R1: 33.37 | R2: 34.18
- Support: S1: 32.60 | S2: 31.91
Trade Suggestion:
- Limit Buy: 32.69
- Take Profit: 33.98
- Stop Loss: 31.97
Crude Oil (WTI) Holds Steady Above $68.00
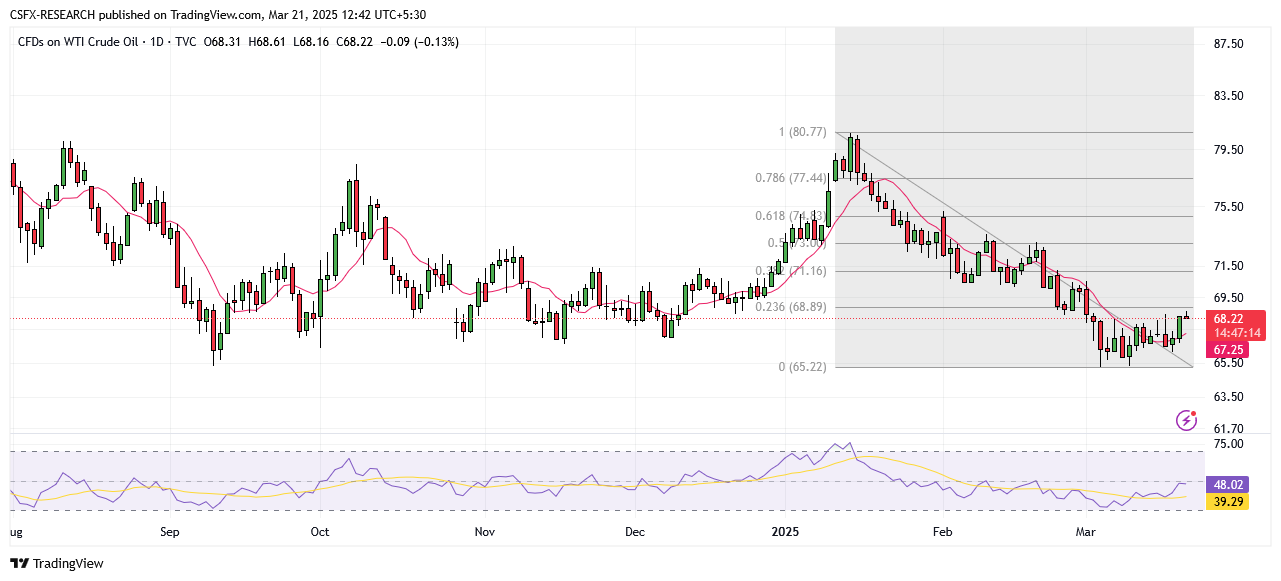
WTI oil prices remain firm, on track for a second consecutive weekly gain, supported by US sanctions on Iran and OPEC+ production cuts.
Key Market Insights:
- WTI trades around $68.40 per barrel during Asian hours.
- The US Treasury has imposed new sanctions on Chinese refiners purchasing Iranian crude.
- OPEC+ plans to reduce production by up to 435,000 bpd monthly through June 2026.
- Geopolitical risks, including Israel’s military actions in Gaza and US strikes on Iran-backed rebels, add further support.
Technical Overview
Moving Averages:
- Exponential: MA 10: 67.62 | Bullish | Positive Crossover
- Simple: MA 10: 67.20 | Bullish | Positive Crossover
Indicators:
- RSI: 47.80 | Neutral Zone
- Stochastic Oscillator: 61.29 | Neutral | Buy Zone
Key Levels:
- Resistance: R1: 73.75 | R2: 75.35
- Support: S1: 68.54 | S2: 66.94
Trade Suggestion:
- Limit Buy: 67.62
- Take Profit: 68.77
- Stop Loss: 67.03
Natural Gas Faces Resistance at $4.322 Ahead of Storage Data Release
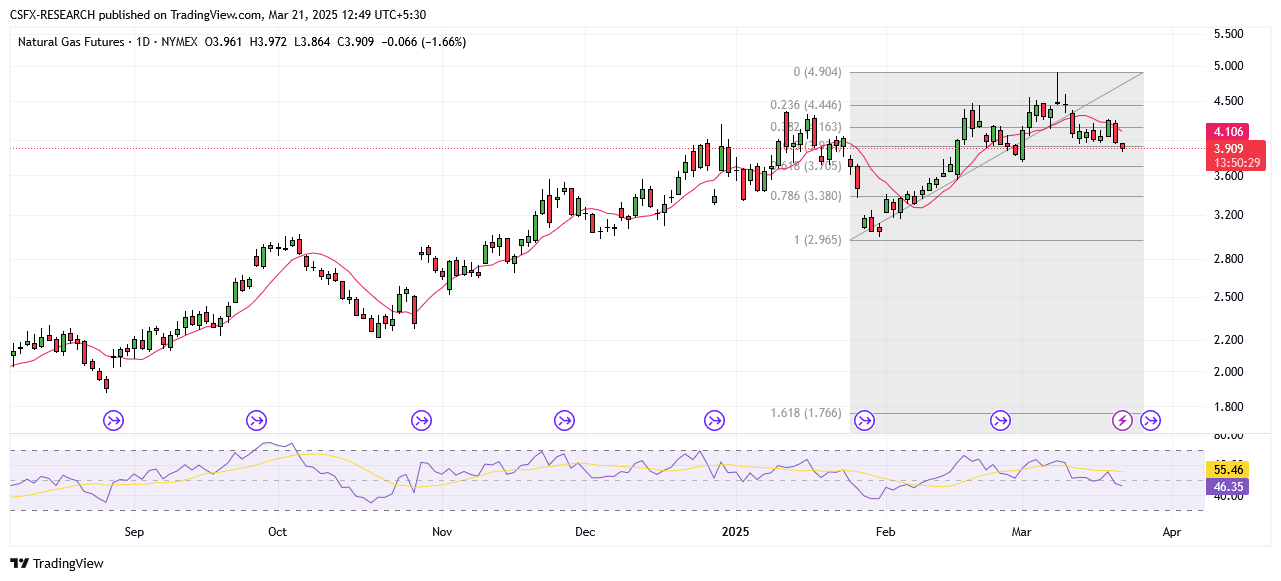
US natural gas futures test the key $4.322 resistance level, with traders closely watching upcoming storage data and weather forecasts.
Key Market Insights:
- A breakout above $4.322 could push prices toward $4.713–$4.901.
- Failure to breach resistance might result in a decline toward $3.900.
- LNG exports have risen 16.6%, reaching 16.0 Bcf/day.
- US storage levels are projected to be 10% below the five-year average.
- Cooler weather forecasts for April could increase demand, supporting prices.
Technical Overview
Moving Averages:
- Exponential: MA 10: 4.12 | Bearish | Negative Crossover
- Simple: MA 10: 4.16 | Bearish | Negative Crossover
Indicators:
- RSI: 45.91 | Neutral Zone
- Stochastic Oscillator: 17.79 | Sell Zone | Neutral
Key Levels:
- Resistance: R1: 4.36 | R2: 4.62
- Support: S1: 3.52 | S2: 3.26
Trade Suggestion:
- Limit Sell: 4.032
- Take Profit: 3.747
- Stop Loss: 4.248
Elsewhere in the Commodity Market
- Gold down (0.44%) at 3030.42
- Silver down (1.47%) at 33.08
- Palladium up (0.05%) at 950.21
- Platinum down (0.24%) at 984.41
- Brent Crude Oil down (0.18%) at 72.11
- WTI Crude Oil down (0.18%) at 68.23
Key Economic Events & Data Release Today:
- (CAD) Core Retail Sales (MoM) (Jan): Forecast -0.1%, Previous 2.7% (18:00 GMT)
- (CAD) Retail Sales (MoM) (Jan): Forecast -0.1%, Previous 2.7% (18:00 GMT)