

Commodities traded mixed on Thursday, with gold and silver under pressure amid improving US-China trade sentiment and a stronger US Dollar. Crude oil prices slid due to demand concerns and signals from Saudi Arabia indicating potential supply flexibility. Meanwhile, natural gas held firm, showing early signs of bullish momentum after a recent technical breakout.
KEY HIGHLIGHTS
- Gold Slides to Two-Week Low Amid Stronger Dollar Pressure
- Silver Declines Toward $32.00 as Bearish Momentum Builds
- WTI Crude Falls Below $58.00 on Demand Worries
- Natural Gas Steady Near $3.39 with Bullish Momentum Rising
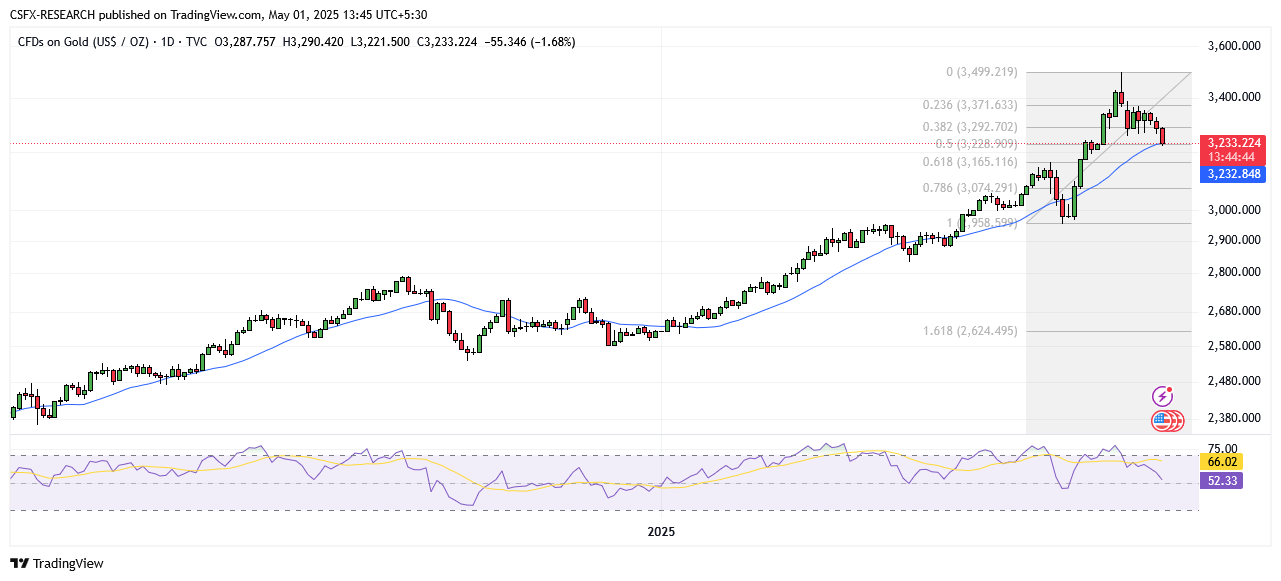
Gold (XAU/USD): Vulnerable Near Two-Week Low Amid Risk-On Sentiment
Gold prices remain subdued, hovering around the $3,232 level during early European trading on Thursday. The metal trades near a two-week low, pressured by:
- Improving global risk sentiment as US-China trade tensions ease.
- Renewed strength in the US Dollar, drawing investors away from the non-yielding asset.
- Weak US Q1 GDP and softening inflation raising expectations of potential Federal Reserve rate cuts, which may support gold in the near term.
A decisive breakdown below the current level could confirm a short-term top and prompt a deeper correction from the recent all-time high near $3,500.
Technical Overview

Moving Averages
- Exponential:
- MA 10: 3289.07 – Bearish
- MA 20: 3242.57 – Bearish
- MA 50: 3109.20 – Bullish
- Simple:
- MA 10: 3326.78 – Bearish
- MA 20: 3232.83 – Bullish
- MA 50: 3080.42 – Bullish
Indicators
- RSI: 52.33 – Bullish (Buy Zone)
- Stochastic Oscillator: 44.61 – Neutral
Key Levels
- Resistance: R1: 3455.95 | R2: 3584.20
- Support: S1: 3040.74 | S2: 2912.49
Outlook
- Overall Sentiment: Neutral
- Market Direction: Buy
Trade Suggestion
- Limit Buy: 3222.00
- Take Profit: 3275.20
- Stop Loss: 3195.50
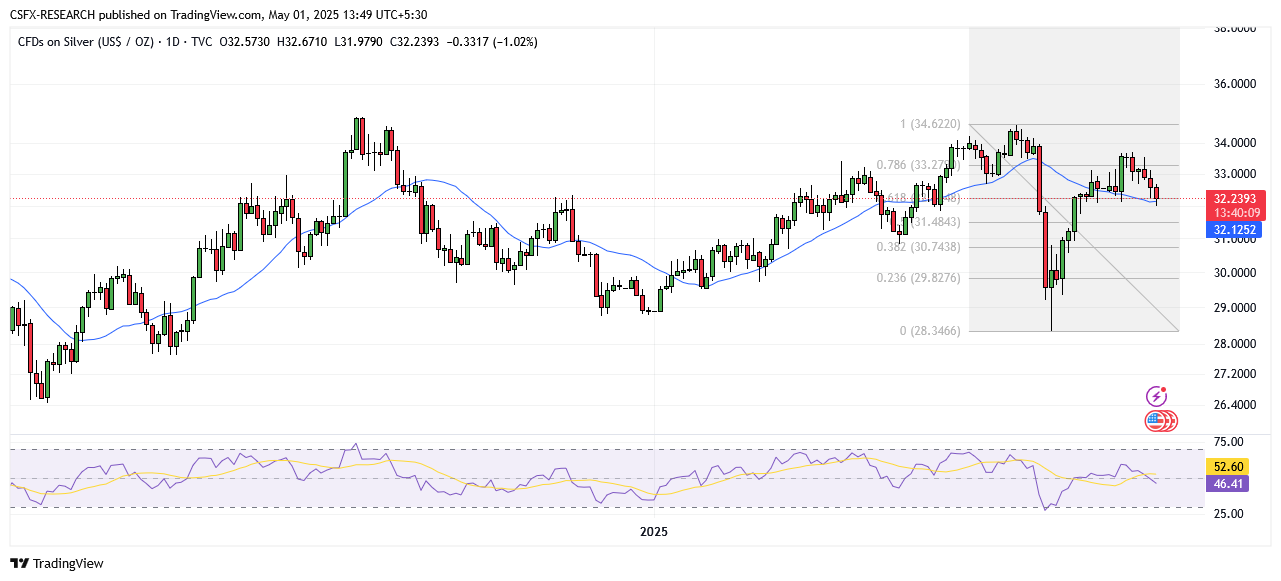
Silver (XAG/USD): Bearish Momentum Dominates Near $32.00
Silver prices continue to trend lower, marking their fourth decline in the last five sessions. The metal slipped to a multi-week low during the Asian session and remains under downward pressure despite holding just above $32.00.
A firm breakdown below this level may lead to further losses toward the $31.70–$31.50 support zone, with risk extending below $31.00 if momentum persists.
Technical Overview
Moving Averages
- Exponential:
- MA 10: 32.69 – Bearish
- MA 20: 32.61 – Bearish
- MA 50: 31.97 – Bullish
- Simple:
- MA 10: 32.86 – Bearish
- MA 20: 32.07 – Bullish
- MA 50: 31.65 – Bullish
Indicators
- RSI: 46.50 – Neutral
- Stochastic Oscillator: 36.41 – Negative (Sell Zone)
Key Levels
- Resistance: R1: 32.86 | R2: 34.09
- Support: S1: 31.91 | S2: 30.77
Outlook
- Overall Sentiment: Neutral
- Market Direction: Sell
Trade Suggestion
- Limit Sell: 32.43
- Take Profit: 31.71
- Stop Loss: 32.93
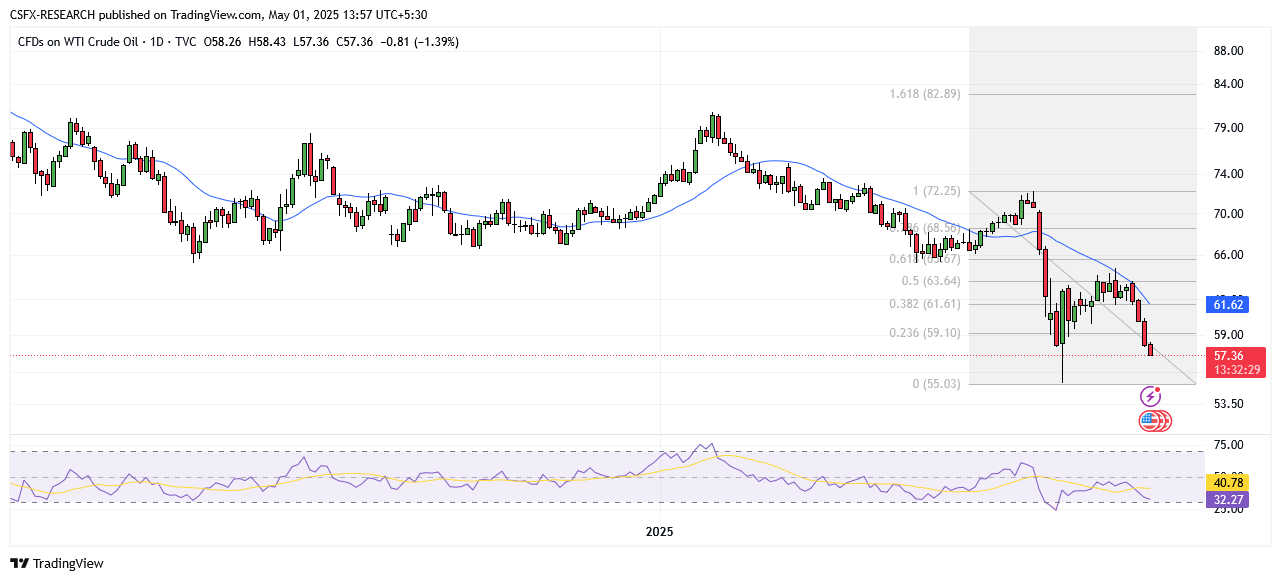
Crude Oil (WTI): Slips Below $58.00 on Demand Concerns and Saudi Supply Stance
WTI crude oil continues to face selling pressure, trading around $57.80 during Thursday’s Asian session. The decline comes amid:
- Demand concerns stemming from global economic slowdown risks.
- Saudi Arabia’s signal that it may allow prices to fall further to enforce compliance rather than immediately cut output.
- A 0.3% contraction in US Q1 GDP, pointing to weaker economic activity.
On the supportive side, the EIA reported an unexpected 2.696 million barrel decline in US crude inventories, suggesting underlying demand may still hold.
Technical Overview
Moving Averages
- Exponential:
- MA 10: 60.80 – Bearish
- MA 20: 62.35 – Bearish
- MA 50: 65.32 – Bearish
- Simple:
- MA 10: 61.70 – Bearish
- MA 20: 61.76 – Bearish
- MA 50: 65.91 – Bearish
Indicators
- RSI: 31.79 – Bearish (Sell Zone)
- Stochastic Oscillator: 18.57 – Negative (Sell Zone)
Key Levels
- Resistance: R1: 68.40 | R2: 72.45
- Support: S1: 55.30 | S2: 51.25
Outlook
- Overall Sentiment: Bearish
- Market Direction: Sell
Trade Suggestion
- Limit Sell: 58.22
- Take Profit: 56.05
- Stop Loss: 59.70
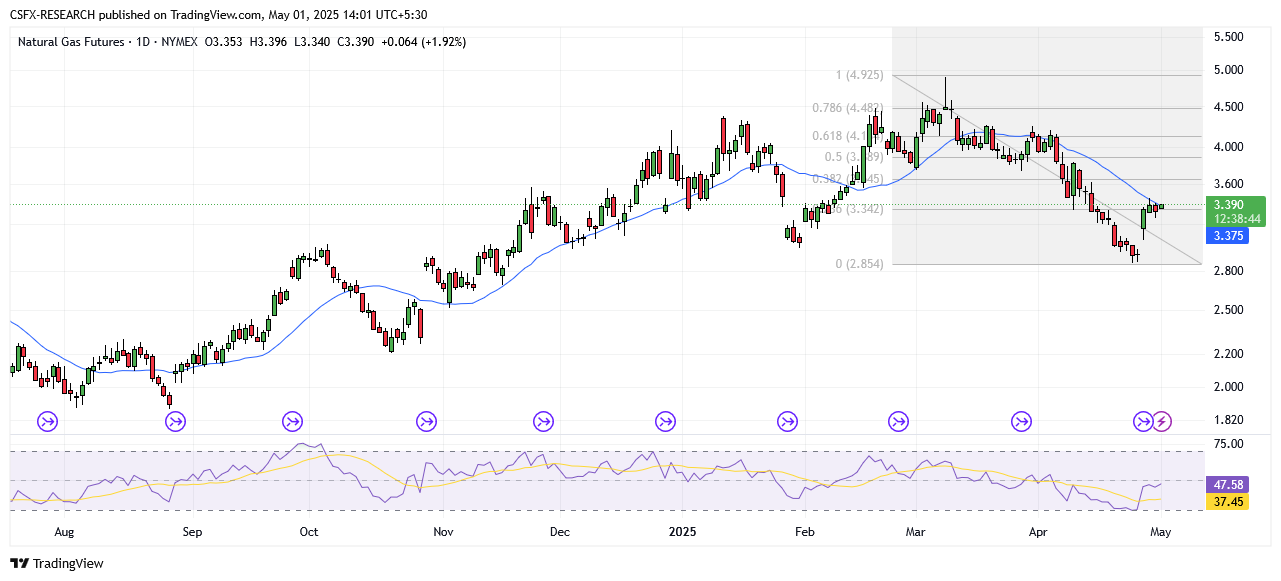
Natural Gas: Stable Near $3.39, Bullish Setup in Focus
Natural gas prices are consolidating near $3.39 after last week’s breakout from a falling wedge pattern. Price action remains supported by:
- Short-term rising trendline.
- Break above 50-day EMA ($3.32), which now acts as immediate support.
- Positive MACD crossover suggesting fresh buying interest.
A daily close above $3.459 may confirm further upside. However, failure to hold the trendline could lead to tests of support near $3.294 and $3.174.
Technical Overview
Moving Averages
- Exponential:
- MA 10: 3.231 – Bullish
- MA 20: 3.363 – Bearish
- MA 50: 3.598 – Bearish
- Simple:
- MA 10: 3.146 – Bullish
- MA 20: 3.356 – Bearish
- MA 50: 3.830 – Bearish
Indicators
- RSI: 43.23 – Neutral
- Stochastic Oscillator: 46.31 – Neutral
Key Levels
- Resistance: R1: 3.938 | R2: 4.244
- Support: S1: 2.948 | S2: 2.642
Outlook
- Overall Sentiment: Neutral
- Market Direction: Buy
Trade Suggestion
- Limit Buy: 3.22
- Take Profit: 3.61
- Stop Loss: 3.02
Elsewhere in the Commodity Market
- Gold: ↓ 1.65% at 3233.88
- Silver: ↓ 1.01% at 32.25
- Palladium: ↑ 0.34% at 945.74
- Platinum: ↓ 0.33% at 965.49
- Brent Crude: ↓ 1.44% at 60.18
- WTI Crude: ↓ 1.59% at 57.29
Key Economic Events Today
- Japan – BoJ Interest Rate Decision: Forecast: 0.50% | Previous: 0.50% | Time: 08:30
- US – Initial Jobless Claims: Forecast: 224K | Previous: 222K | Time: 18:00
- US – ISM Manufacturing PMI (Apr): Forecast: 48.0 | Previous: 49.0 | Time: 19:30