

Gold and silver prices rise as the US Dollar weakens amid increasing expectations of Federal Reserve rate cuts, while crude oil remains under pressure due to easing geopolitical risks. Meanwhile, natural gas prices hover below key resistance, indicating a potential bearish trend. Traders now focus on upcoming US economic data for further market direction.
KEY HIGHLIGHTS
- Gold Gains as USD Weakens, Fed Rate Cuts Expected.
- Silver Rises Amid US Slowdown Concerns, Tariff Speculation Grows.
- Crude Oil Slips on Ukraine Ceasefire Progress, Supply Uncertainty.
- Natural Gas Weakens Below Key Resistance, Bearish Momentum Builds.
Gold Market Analysis (XAU/USD)
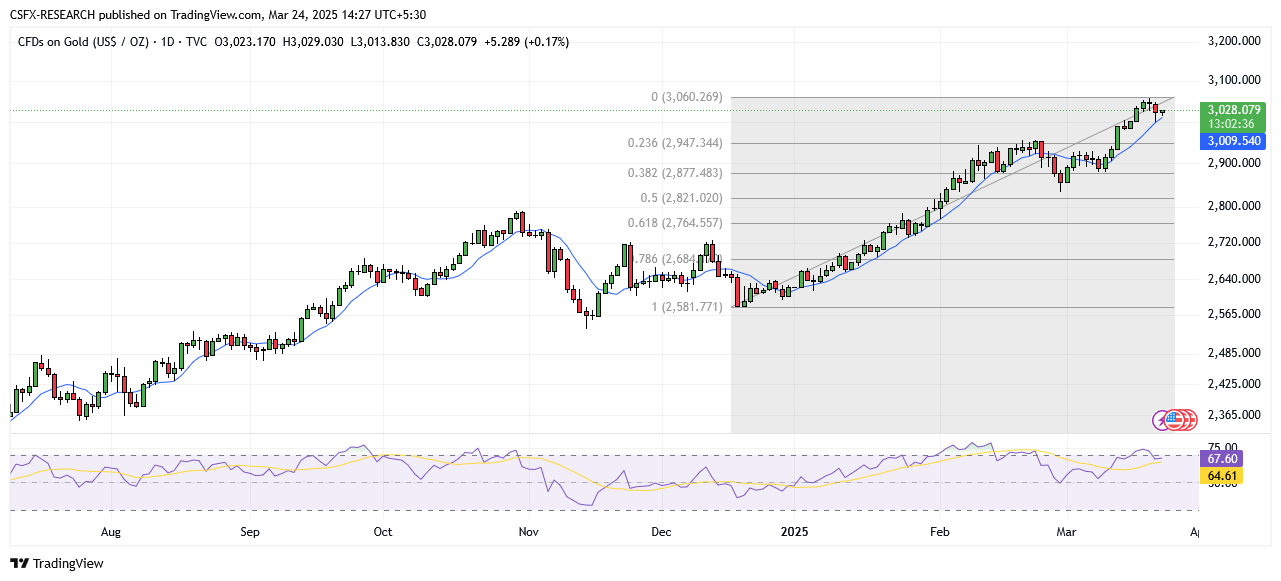
Gold Prices Find Support as USD Weakens
Gold prices (XAU/USD) edge higher in early European trading, extending their rebound from the $3,000 psychological level. A weaker US Dollar halts its three-day recovery from a multi-month low, driven by growing expectations that the Federal Reserve (Fed) will soon resume rate cuts. This provides support for the non-yielding yellow metal.
Additionally, global risk sentiment improves slightly following reports that former US President Donald Trump’s proposed reciprocal tariffs will be narrower than initially anticipated. However, rising US Treasury bond yields could limit aggressive bullish bets on gold. Traders now await the release of flash US PMI data and speeches from key FOMC members for near-term trading signals.
Technical Overview

Moving Averages
Exponential:
- MA 10: 3002.13 | Positive Crossover | Bullish
- MA 20: 2966.17 | Positive Crossover | Bullish
- MA 50: 2884.57 | Positive Crossover | Bullish
Simple:
- MA 10: 2999.95 | Positive Crossover | Bullish
- MA 20: 2949.96 | Positive Crossover | Bullish
- MA 50: 2874.48 | Positive Crossover | Bullish
Indicators:
- RSI (Relative Strength Index): 67.91 | Buy Zone | Bullish
- Stochastic Oscillator: 85.82 | Buy Zone | Neutral
Resistance & Support Levels:
- R1: 2932.05 | R2: 2975.46
- S1: 2791.51 | S2: 2748.10
Overall Sentiment: Bullish
Market Direction: Buy
Trade Suggestion:
- Limit Buy: 3018.00
- Take Profit: 3048.20
- Stop Loss: 3003.60
Silver Market Analysis (XAG/USD)
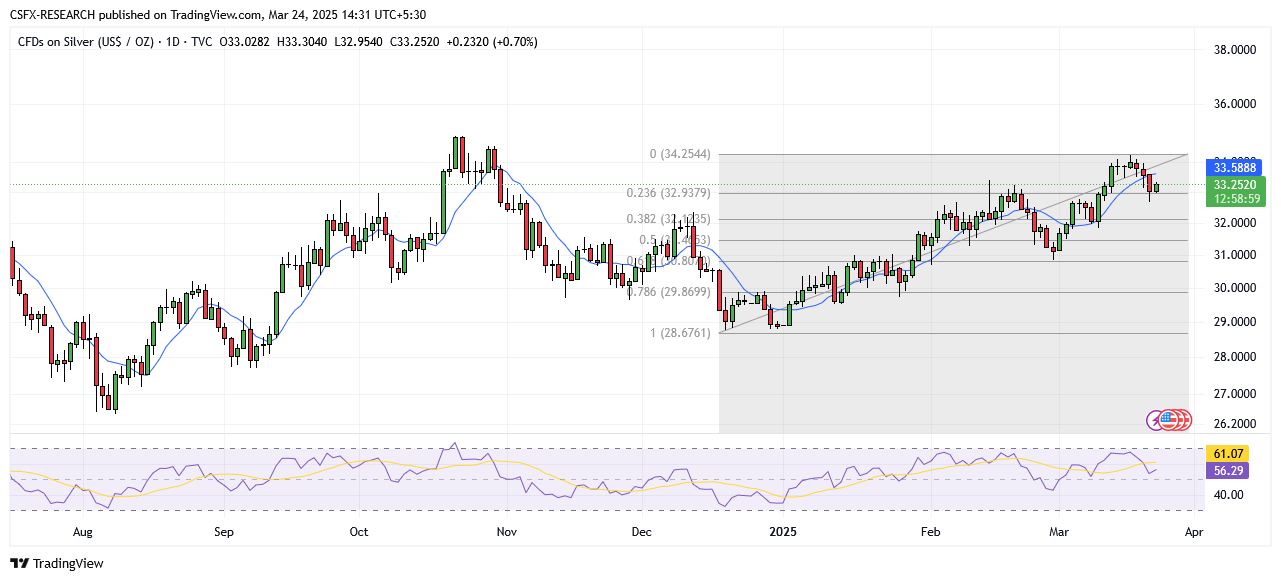
Silver Holds Steady Amid US Economic Concerns
Silver prices (XAG/USD) trade near $33.10 per troy ounce after three consecutive losses. A weaker US Dollar supports silver amid concerns over a potential US economic slowdown. However, expectations of two Fed rate cuts in 2025 may limit silver’s upside potential.
Market focus now shifts to preliminary US S&P Global Manufacturing PMI data. Additionally, revisions in the White House’s tariff strategy may impact silver prices as the US government adjusts its trade policies.
Technical Overview
Moving Averages
Exponential:
- MA 10: 33.49 | Negative Crossover | Bearish
- MA 20: 32.58 | Positive Crossover | Bullish
- MA 50: 31.10 | Positive Crossover | Bullish
Simple:
- MA 10: 33.27 | Negative Crossover | Bearish
- MA 20: 32.93 | Positive Crossover | Bullish
- MA 50: 31.56 | Positive Crossover | Bullish
Indicators:
- RSI: 56.29 | Buy Zone | Bullish
- Stochastic Oscillator: 36.01 | Sell Zone | Neutral
Resistance & Support Levels:
- R1: 33.36 | R2: 34.11
- S1: 32.71 | S2: 32.23
Overall Sentiment: Bullish
Market Direction: Buy
Trade Suggestion:
- Limit Buy: 32.75
- Take Profit: 34.00
- Stop Loss: 32.02
Crude Oil Market Analysis (WTI/USD)
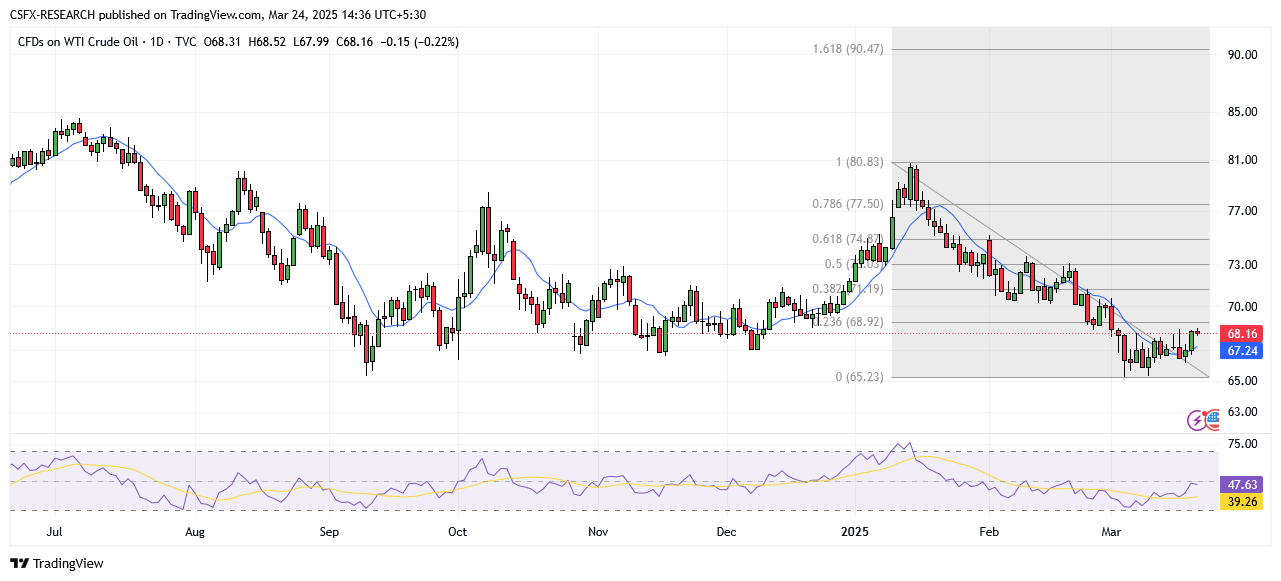
WTI Crude Oil Struggles Amid Ceasefire Talks
West Texas Intermediate (WTI) crude oil prices trade near $68.00 per barrel, extending their decline for a second consecutive session. The market remains subdued amid ongoing ceasefire discussions between Ukrainian and US officials, which may lead to increased Russian oil supply.
Analysts suggest that expectations of progress in Russia-Ukraine peace talks and a potential easing of US sanctions on Russian oil are pressuring prices. Investors remain cautious as they monitor OPEC+ production trends beyond April.
Technical Overview
Resistance & Support Levels:
- R1: 73.75 | R2: 75.35
- S1: 68.54 | S2: 66.94
Overall Sentiment: Bearish
Market Direction: Sell
Trade Suggestion:
- Limit Sell: 68.86
- Take Profit: 67.22
- Stop Loss: 69.97
Natural Gas Market Analysis (NG/USD)
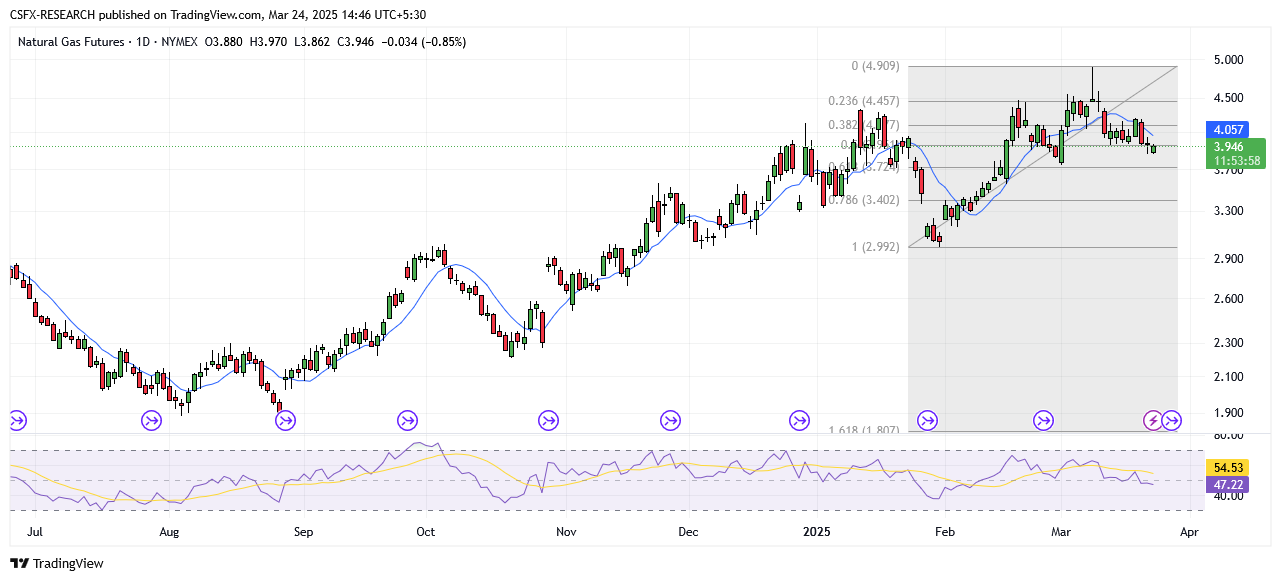
Natural Gas Prices Show Modest Fluctuations
Natural Gas (NG) trades around $3.95, just below its pivot point of $4.05. The price has broken below a symmetrical triangle, indicating a potential bearish trend. Immediate support is seen at $3.86, with a breakdown potentially leading to $3.75.
Technical Overview
Resistance & Support Levels:
- R1: 4.36 | R2: 4.62
- S1: 3.52 | S2: 3.26
Overall Sentiment: Bearish
Market Direction: Sell
Trade Suggestion:
- Limit Sell: 4.06
- Take Profit: 3.82
- Stop Loss: 4.24
Commodity Market Overview
- Gold up (0.21%) at 3029.32
- Silver up (0.60%) at 33.22
- Palladium up (0.88%) at 962.68
- Platinum up (0.21%) at 979.57
- Brent Crude Oil down (0.17%) at 72.01
- WTI Crude Oil down (0.21%) at 68.17
Key Economic Events Today:
- USD S&P Global Manufacturing PMI (Mar): Forecast 51.9, Previous 52.7 (19:15 GMT)
- USD S&P Global Services PMI (Mar): Forecast 51.2, Previous 51.0 (19:15 GMT)