

The commodity markets showed mixed movements on Friday as investors remained cautious ahead of the key US Non-Farm Payrolls (NFP) report. Gold and silver struggled to extend their recent gains, while crude oil prices rebounded due to easing geopolitical concerns. Natural gas held key support levels, signaling potential for further upside.
KEY HIGHLIGHTS
- Gold Struggles as Markets Await Key US Jobs Report
- Silver Recovers but Faces Resistance amid Bearish Technical Signals
- Crude Oil Rises on Hopes of Eased Trade Tensions
- Natural Gas Holds Support, Eyes Retest of Key Resistance
Gold (XAU/USD)
Market Overview
Gold prices are struggling to extend intraday gains, hovering below key resistance levels amid a positive risk sentiment. Investor focus remains on the upcoming US Non-Farm Payrolls data, which could influence expectations around future Federal Reserve monetary policy.
- Gold remains below the $3,260–$3,265 zone, which now acts as resistance.
- Improved sentiment from potential US-China trade talks has weighed on safe-haven demand.
- Despite this, gold is on track for its strongest weekly gain in over two months.
- Market awaits clarity from NFP data, which could shift USD direction and gold momentum.
Technical Overview

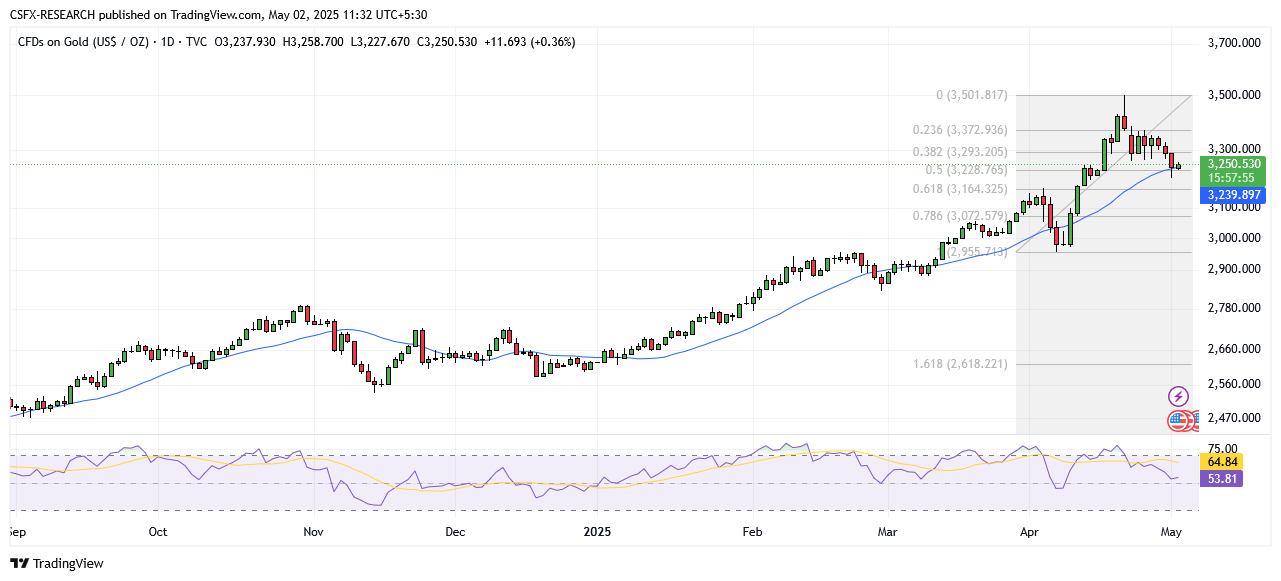
Moving Averages
Exponential:
- MA 10: 3283.05 – Bearish (Negative crossover)
- MA 20: 3243.89 – Bullish (Positive crossover)
- MA 50: 3114.98 – Bullish (Positive crossover)
Simple:
- MA 10: 3319.79 – Bearish (Negative crossover)
- MA 20: 3239.96 – Bullish (Positive crossover)
- MA 50: 3086.77 – Bullish (Positive crossover)
Indicators
- RSI: 53.90 – Bullish (Buy zone)
- Stochastic Oscillator: 29.64 – Neutral (Sell zone)
Key Levels
- Resistance: R1: 3455.95 | R2: 3584.20
- Support: S1: 3040.74 | S2: 2912.49
Overall Sentiment: Bullish
Market Direction: Buy
Trade Suggestion:
- Limit Buy: 3194.00
- Take Profit: 3314.50
- Stop Loss: 3126.43
Silver (XAG/USD)
Market Overview
Silver extended gains during the Asian session, bouncing from a three-week low and trading back above the $32.00 handle. Despite the recovery, technical indicators suggest limited upside unless strong buying resumes.
- Recovered from $31.65, breaking a three-day losing streak.
- Below the 100-hour SMA, indicating a bearish technical tone.
- Immediate resistance at $32.80 and $33.00, with stronger resistance at $33.70 and $34.00.
- Support is seen near $32.25–$32.20, followed by $32.00.
Technical Overview
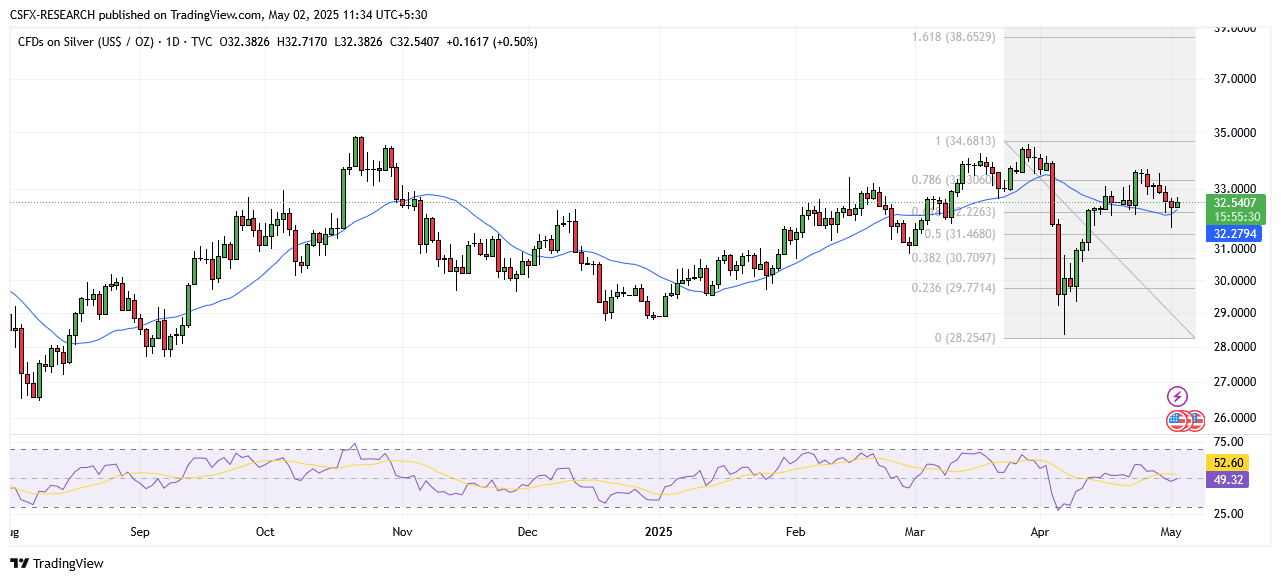
Moving Averages
Exponential:
- MA 10: 32.68 – Bearish
- MA 20: 32.62 – Bearish
- MA 50: 31.90 – Bullish
Simple:
- MA 10: 32.88 – Bearish
- MA 20: 32.12 – Bullish
- MA 50: 31.60 – Bullish
Indicators
- RSI: 49.62 – Bullish (Buy zone)
- Stochastic Oscillator: 19.35 – Neutral (Sell zone)
Key Levels
- Resistance: R1: 32.86 | R2: 34.09
- Support: S1: 31.91 | S2: 30.81
Overall Sentiment: Neutral
Market Direction: Buy
Trade Suggestion:
- Limit Buy: 32.69
- Take Profit: 33.66
- Stop Loss: 32.05
Crude Oil (WTI)
Market Overview
Crude oil prices climbed toward $59.50 amid improving global trade sentiment. Comments from US officials regarding potential deals with several countries, including China, supported bullish momentum. However, long-term risks persist due to weak demand indicators and trade uncertainty.
- Price gains supported by potential easing of US-China trade tensions.
- Trump’s threat of secondary sanctions on Iranian oil buyers added to bullish momentum.
- Despite the rebound, oil remains on course for a 5% weekly loss.
- Economic data such as lower US GDP and China’s factory slowdown continue to weigh on demand outlook.
Technical Overview
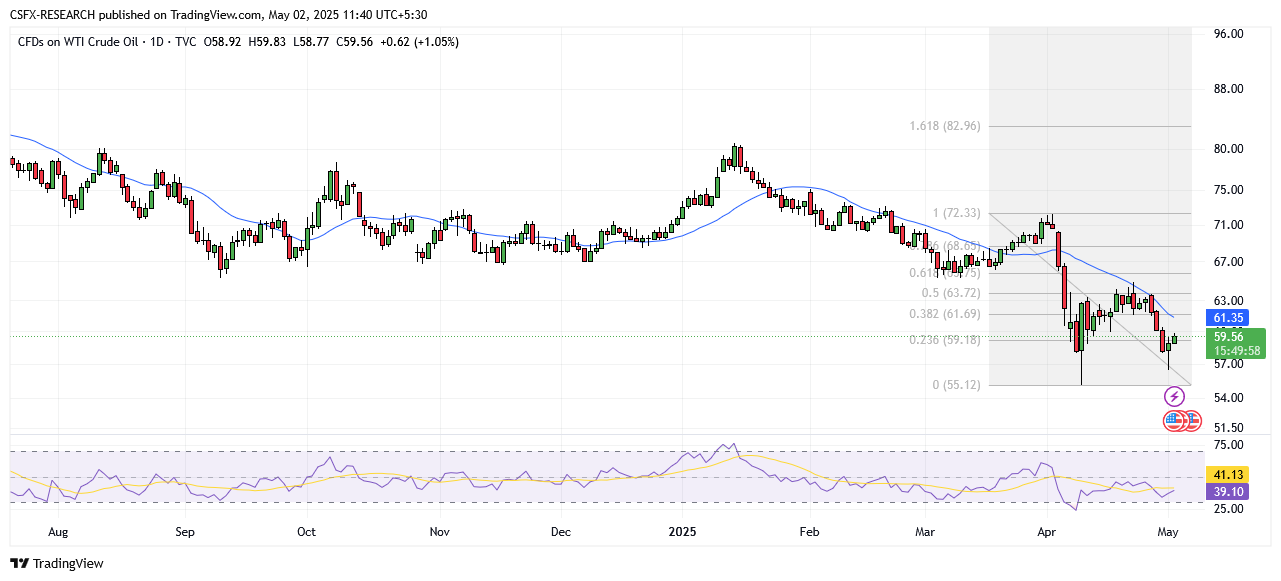
Moving Averages
Exponential:
- MA 10: 60.82 – Bearish
- MA 20: 62.23 – Bearish
- MA 50: 65.16 – Bearish
Simple:
- MA 10: 61.38 – Bearish
- MA 20: 61.49 – Bearish
- MA 50: 65.69 – Bearish
Indicators
- RSI: 38.86 – Bearish (Sell zone)
- Stochastic Oscillator: 24.43 – Neutral (Sell zone)
Key Levels
- Resistance: R1: 68.40 | R2: 72.45
- Support: S1: 55.30 | S2: 51.25
Overall Sentiment: Bearish
Market Direction: Sell
Trade Suggestion:
- Limit Sell: 61.37
- Take Profit: 57.64
- Stop Loss: 64.13
Natural Gas
Market Overview
Natural gas continues to trade above key moving averages, suggesting bullish momentum is intact. While a pullback from $3.543 has occurred, support near $3.419 may serve as a base for a renewed upward move.
- Current prices supported by 50-hour EMA at $3.391 and 200-hour EMA at $3.343.
- A successful hold above $3.419 could trigger another test of $3.543 and $3.659.
- A break below trendline support could lead to declines toward $3.285.
Technical Overview
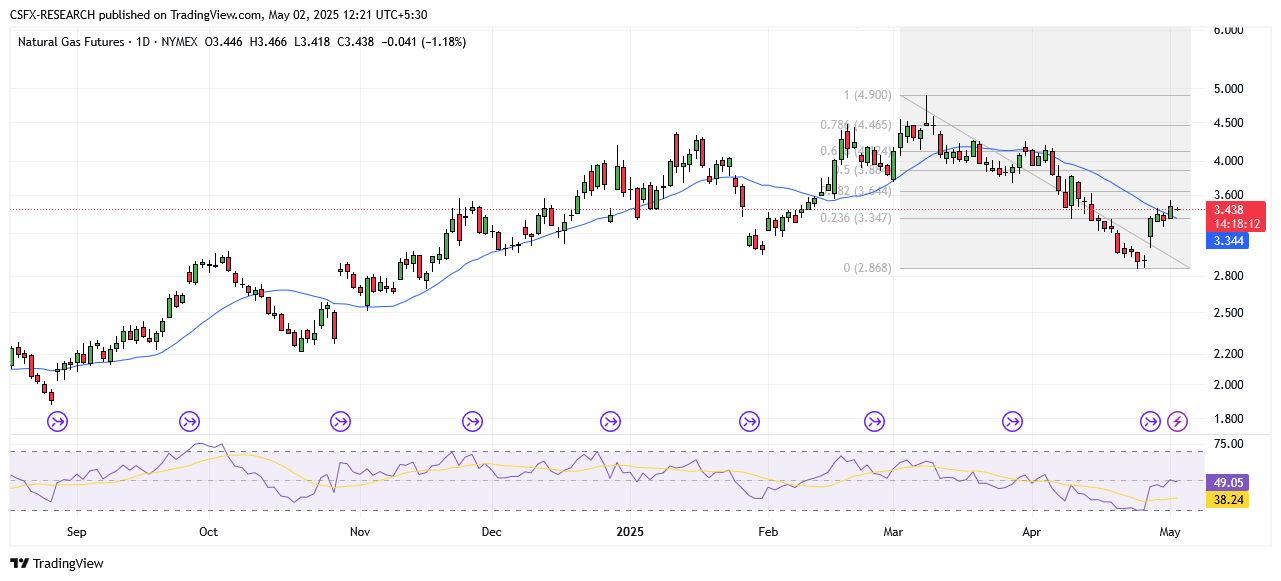
Moving Averages
Exponential:
- MA 10: 3.2570 – Bullish
- MA 20: 3.3642 – Bearish
- MA 50: 3.5894 – Bearish
Simple:
- MA 10: 3.1581 – Bullish
- MA 20: 3.3202 – Bullish
- MA 50: 3.8130 – Bearish
Indicators
- RSI: 45.09 – Neutral
- Stochastic Oscillator: 55.50 – Neutral (Buy zone)
Key Levels
- Resistance: R1: 3.9384 | R2: 4.2443
- Support: S1: 2.9483 | S2: 2.6424
Overall Sentiment: Neutral
Market Direction: Buy
Trade Suggestion:
- Limit Buy: 3.22
- Take Profit: 3.60
- Stop Loss: 3.06
Commodity Snapshot
- Gold: Up 0.39% at 3251.16
- Silver: Up 0.58% at 32.58
- Palladium: Up 0.65% at 948.58
- Platinum: Up 0.15% at 969.14
- Brent Crude: Up 0.52% at 62.17
- WTI Crude: Up 0.57% at 59.30
Key Economic Events Today
- EUR CPI (YoY) (Apr): Forecast 2.1%, Previous 2.2% – 04:30 GMT
- USD Average Hourly Earnings (MoM) (Apr): Forecast 0.3%, Previous 0.3% – 18:00 GMT
- USD Nonfarm Payrolls (Apr): Forecast 133K, Previous 228K – 18:00 GMT
- USD Unemployment Rate (Apr): Forecast 4.2%, Previous 4.2% – 18:00 GMT