

The commodity markets are witnessing varied trends as traders assess global developments and key economic signals. While optimism surrounding a potential US-China trade deal is dampening the appeal of safe-haven assets like gold, silver maintains technical strength. Oil prices are rising despite persistent oversupply concerns, and natural gas remains under bearish pressure within a descending channel.
KEY HIGHLIGHTS
- Gold Slips as US-China Optimism Pressures Safe-Haven Demand
- Silver Holds Gains, Technical Breakout Signals Continued Bullish Strength
- Oil Rises but Faces Weekly Loss Amid Oversupply Fears
- Natural Gas Struggles Below Resistance, Bearish Channel Still Intact
Markets in Focus Today
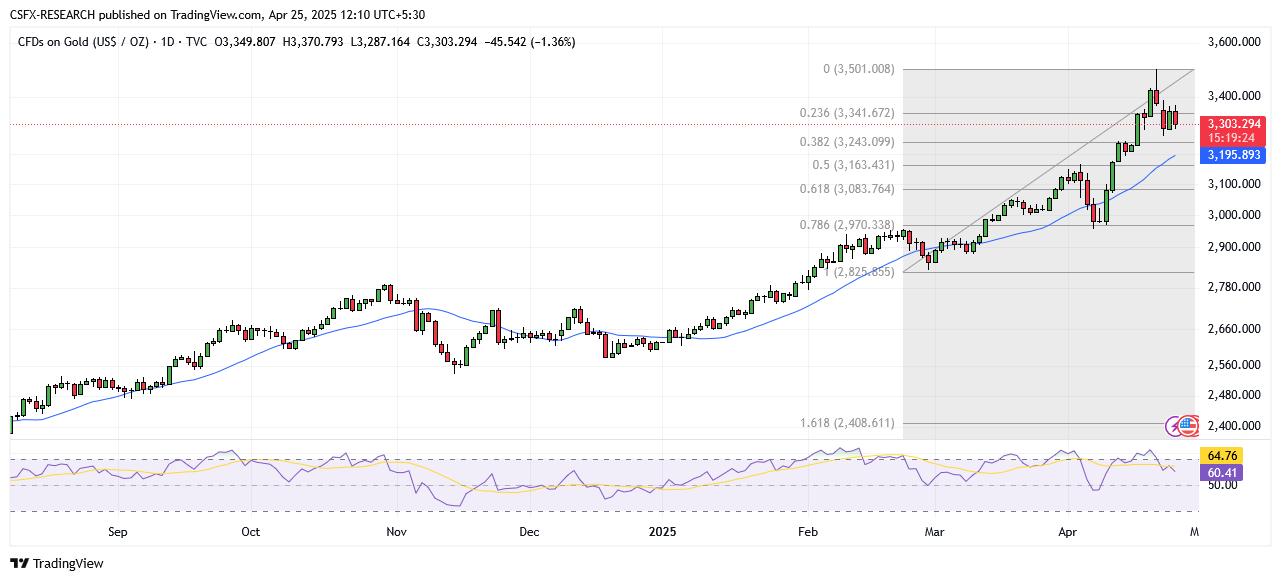
Gold (XAU/USD): Weighed by Trade Optimism and Dollar Strength
Market Overview
Gold prices are under mild pressure amid improved risk sentiment stemming from optimism around a potential de-escalation in US-China trade tensions. This has reduced the demand for safe-haven assets. Additionally, renewed strength in the US Dollar is adding to the downside pressure. However, the Federal Reserve’s dovish stance may limit the USD’s upside and provide some underlying support to gold.
- Gold retraced after testing the $3,370–$3,371 range in the Asian session.
- Support remains from geopolitical uncertainties and the Fed’s dovish signals.
- Traders should await confirmation of selling pressure before assuming a continued pullback from the recent $3,500 all-time high.
Technical Overview

Moving Averages
- Exponential Moving Averages
- MA 10: 3288.21 – Bullish
- MA 20: 3216.59 – Bullish
- MA 50: 3076.29 – Bullish
- Simple Moving Averages
- MA 10: 3307.99 – Bearish
- MA 20: 3195.54 – Bullish
- MA 50: 3049.30 – Bullish
Indicators
- RSI: 59.86 – Buy Zone – Bullish
- Stochastic Oscillator: 65.20 – Buy Zone – Neutral
Key Levels
- Resistance: R1 – 3139.50 | R2 – 3203.71
- Support: S1 – 2931.64 | S2 – 2867.44
Trade Suggestion
- Limit Buy: 3265.00
- Take Profit: 3358.20
- Stop Loss: 3213.74
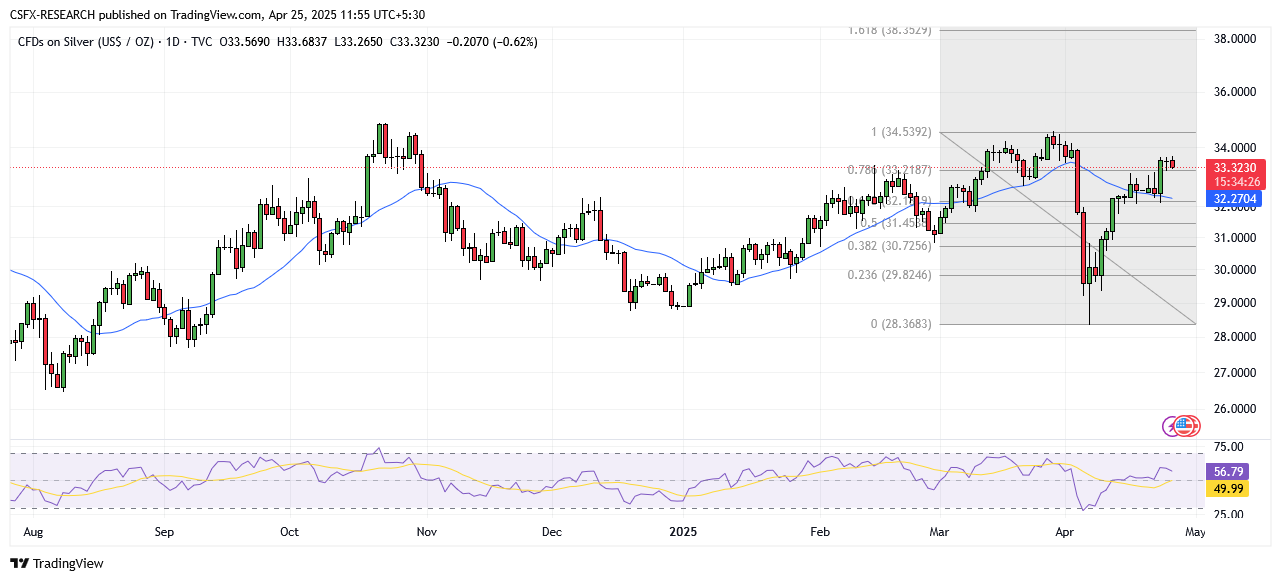
Silver (XAG/USD): Technical Breakout Points to Further Upside
Market Overview
Silver prices are slightly lower after testing a multi-week high, trading in the mid-$33.00s. Despite the pullback, the recent breakout above the $33.00 resistance level, combined with improving momentum indicators, keeps the overall trend bullish.
- The breakout above $33.00 was supported by the 61.8% Fibonacci retracement level.
- Oscillators suggest bullish momentum with room to run before becoming overbought.
- The $33.00 level now serves as critical support, with potential upside targets at $34.00 and beyond.
Technical Overview
Moving Averages
- Exponential Moving Averages
- MA 10: 32.80 – Bullish
- MA 20: 32.60 – Bullish
- MA 50: 31.90 – Bullish
- Simple Moving Averages
- MA 10: 32.76 – Bullish
- MA 20: 32.33 – Bullish
- MA 50: 31.50 – Bullish
Indicators
- RSI: 56.57 – Buy Zone – Bullish
- Stochastic Oscillator: 97.35 – Buy Zone – Neutral
Key Levels
- Resistance: R1 – 33.69 | R2 – 34.56
- Support: S1 – 32.70 | S2 – 31.68
Trade Suggestion
- Limit Buy: 33.00
- Take Profit: 34.14
- Stop Loss: 32.43
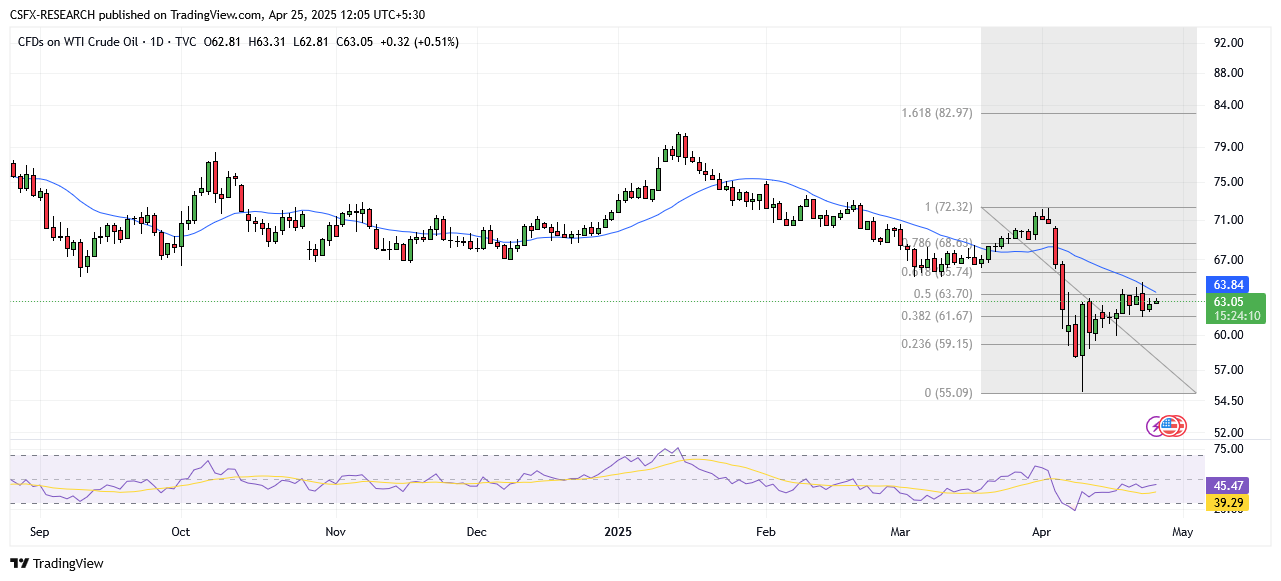
Crude Oil (WTI): Rises Toward $63.00 Despite Weekly Loss Outlook
Market Overview
West Texas Intermediate (WTI) continues its recovery, nearing the $63.00 level. However, oversupply concerns driven by potential OPEC+ production increases are keeping pressure on prices.
- OPEC+ countries may boost output for a second consecutive month.
- Kazakhstan has signaled it will prioritize domestic interests over output cuts.
- Talks between Iran and Western nations could result in eased sanctions and more oil on the market.
Technical Overview
Moving Averages
- Exponential Moving Averages
- MA 10: 62.99 – Bullish
- MA 20: 63.89 – Bearish
- MA 50: 66.36 – Bearish
- Simple Moving Averages
- MA 10: 62.64 – Bullish
- MA 20: 63.99 – Bearish
- MA 50: 66.88 – Bearish
Indicators
- RSI: 45.07 – Neutral Zone – Neutral
- Stochastic Oscillator: 64.25 – Buy Zone – Neutral
Key Levels
- Resistance: R1 – 71.99 | R2 – 73.55
- Support: S1 – 66.94 | S2 – 65.38
Trade Suggestion
- Limit Sell: 63.88
- Take Profit: 61.73
- Stop Loss: 65.43
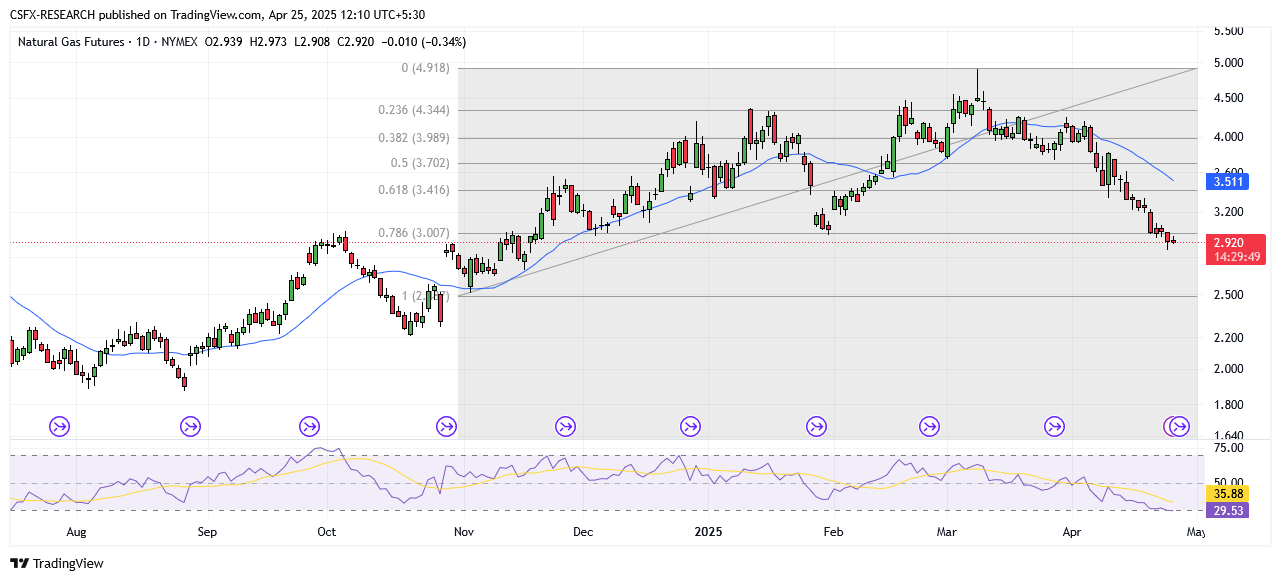
Natural Gas (NG): Stuck in Bearish Channel Below Key Resistance
Market Overview
Natural gas remains under pressure, trading near $2.92 within a defined bearish channel. Resistance at $2.975 continues to cap upward movement.
- Momentum remains weak with both 50 EMA and 200 EMA trending downward.
- A break above $2.975 may open the door to $3.077 and $3.155.
- Failure to hold above $2.900 could signal further downside.
Technical Overview
Moving Averages
- Exponential Moving Averages
- MA 10: 3.1837 – Bearish
- MA 20: 3.4083 – Bearish
- MA 50: 3.6546 – Bearish
- Simple Moving Averages
- MA 10: 3.1818 – Bearish
- MA 20: 3.5081 – Bearish
- MA 50: 3.8919 – Bearish
Indicators
- RSI: 28.88 – Sell Zone – Bearish
- Stochastic Oscillator: 6.98 – Sell Zone – Neutral
Key Levels
- Resistance: R1 – 4.7739 | R2 – 5.0791
- Support: S1 – 3.7861 | S2 – 3.4809
Trade Suggestion
- Limit Sell: 3.07
- Take Profit: 2.68
- Stop Loss: 3.39
Elsewhere in the Commodity Market
- Gold: Down 1.35% at 3303.98
- Silver: Down 0.37% at 33.40
- Palladium: Down 0.80% at 940.01
- Platinum: Up 0.29% at 976.99
- Brent Crude Oil: Up 0.50% at 65.91
- WTI Crude Oil: Up 0.55% at 63.10
Key Economic Events & Data Releases Today
- (GBP) Core Retail Sales (YoY) (Mar)
- Forecast: 2.2% | Previous: 2.2% | Time: 11:30
- (GBP) Retail Sales (YoY) (Mar)
- Forecast: 1.8% | Previous: 2.2% | Time: 11:30
- (CAD) Core Retail Sales (MoM) (Feb)
- Forecast: -0.1% | Previous: 0.2% | Time: 18:00
- (CAD) Retail Sales (MoM) (Feb)
- Forecast: -0.4% | Previous: -0.6% | Time: 18:00