

Precious metals and energy markets remain under pressure midweek, with gold hovering below $3,300, silver consolidating in a narrowing range, and WTI crude slipping toward $59.50 amid global growth concerns. Meanwhile, natural gas futures test key resistance, eyeing a breakout ahead of high-impact U.S. economic data.
KEY HIGHLIGHTS
- Gold struggles below $3,300 as traders await US data.
- Silver dips again, buyers defend support near $32.66 trendline.
- WTI crude slides toward $59.50 on global demand fears.
- Natural gas tests resistance at $3.402, eyes breakout attempt.
Gold Trades Below $3,300 Amid Dollar Strength and Uncertainty
Gold prices remain under pressure near intraday lows, trading below the $3,300 level during early European hours on Wednesday. The downside move is attributed to easing U.S.-China trade tensions, which weakens safe-haven demand, and month-end flows offering mild support to the U.S. Dollar.
However, geopolitical uncertainty due to President Trump’s inconsistent trade policies and anticipation of aggressive Federal Reserve rate cuts limits USD upside, thereby offering some underlying support to gold.
Technical Overview


Moving Averages
- Exponential
- MA 10: 3300.83 | Negative crossover | Bearish
- MA 20: 3243.22 | Positive crossover | Bullish
- MA 50: 3103.99 | Positive crossover | Bullish
- Simple
- MA 10: 3337.10 | Negative crossover | Bearish
- MA 20: 3227.90 | Positive crossover | Bullish
- MA 50: 3074.34 | Positive crossover | Bullish
Indicators
- RSI: 57.26 | Buy zone | Bullish
- Stochastic Oscillator: 61.89 | Buy zone | Neutral
Support and Resistance Levels
- Resistance: R1 – 3139.51 | R2 – 3203.71
- Support: S1 – 2931.64 | S2 – 2867.44
Market Outlook
- Overall Sentiment: Bullish
- Market Direction: Buy
Trade Suggestion
- Limit Buy: 3248.00
- Take Profit: 3370.00
- Stop Loss: 3182.50
Silver (XAG/USD)
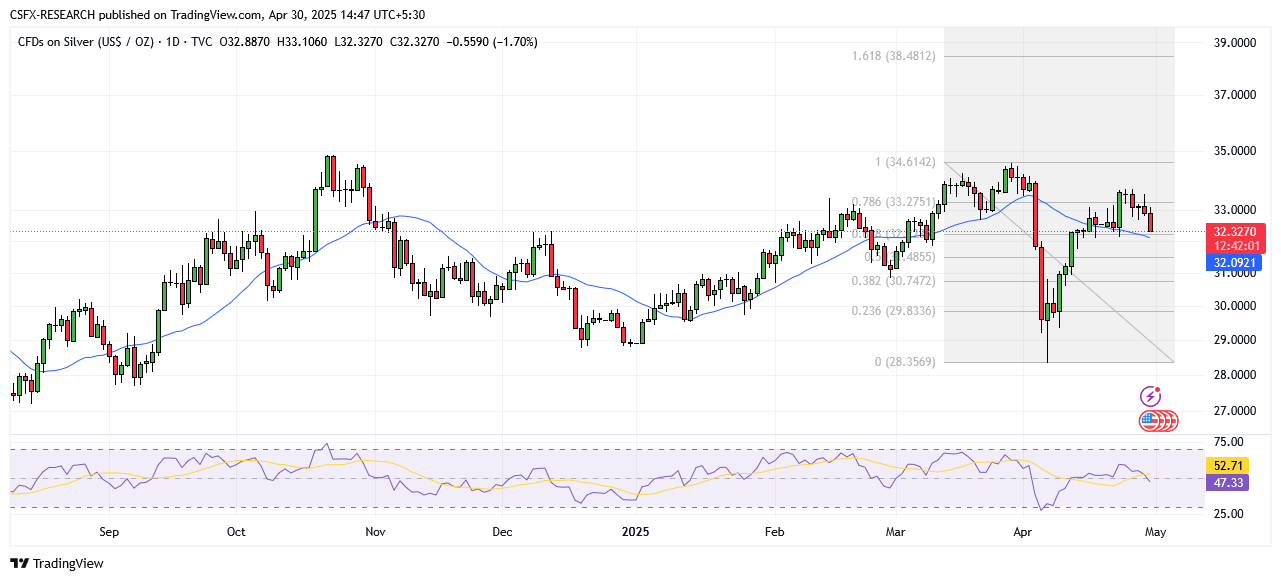
Silver Tests Trendline Support in Narrowing Wedge
Silver continues to face intraday pressure, trading at $32.86 after rebounding from key trendline support at $32.66. The metal is consolidating between a rising support and descending resistance, forming a narrowing wedge pattern.
The 50 EMA at $33.07 and 200 EMA at $32.70 provide short-term structure, with long lower wicks indicating buyer interest. However, a decisive breakout above $33.19 is needed to confirm bullish continuation.
Technical Overview
Moving Averages
- Exponential
- MA 10: 32.88 | Negative crossover | Bearish
- MA 20: 32.14 | Positive crossover | Bullish
- MA 50: 31.61 | Positive crossover | Bullish
- Simple
- MA 10: 32.74 | Negative crossover | Bearish
- MA 20: 32.62 | Negative crossover | Bearish
- MA 50: 31.90 | Positive crossover | Bullish
Indicators
- RSI: 46.62 | Neutral zone | Neutral
- Stochastic Oscillator: 60.49 | Buy zone | Neutral
Support and Resistance Levels
- Resistance: R1 – 33.65 | R2 – 34.84
- Support: S1 – 32.19 | S2 – 31.16
Market Outlook
- Overall Sentiment: Neutral
- Market Direction: Buy
Trade Suggestion
- Limit Buy: 32.03
- Take Profit: 33.01
- Stop Loss: 31.48
Crude Oil (WTI)
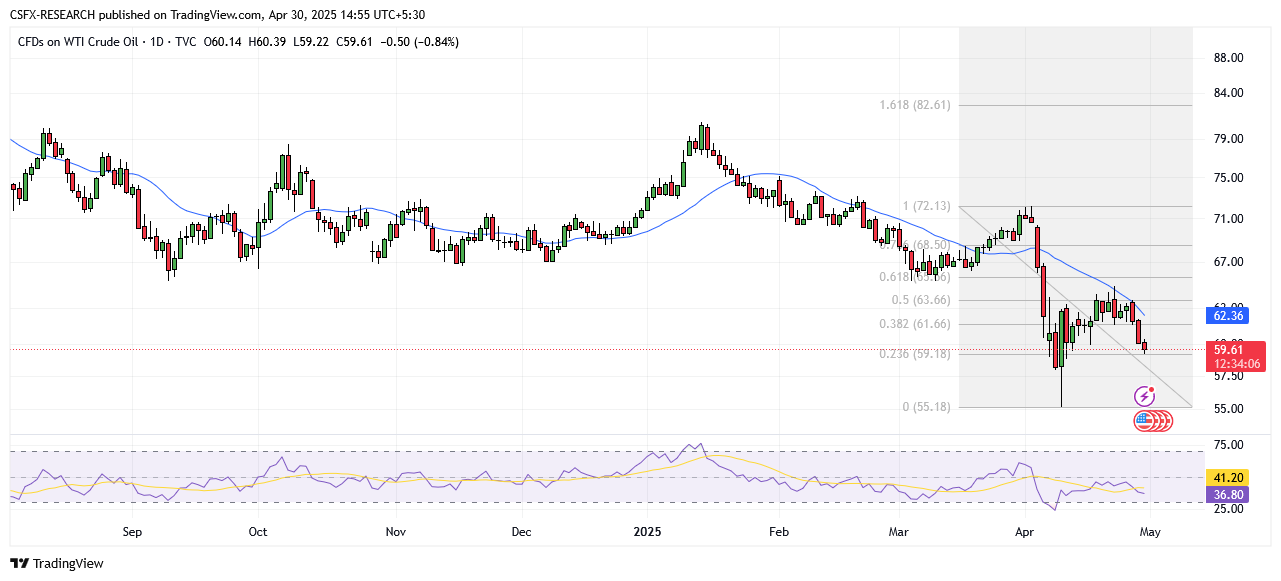
WTI Crude Extends Losses Toward $59.50 on Growth Fears
WTI crude oil continues to fall, now trading near $59.50 per barrel, driven by concerns over global economic growth and weaker demand due to trade policy uncertainties. The commodity is set for its sharpest monthly decline since November 2021, with a drop exceeding 15%.
Investor sentiment has worsened with a significant decline in the U.S. Consumer Confidence Index and continued tensions between the U.S. and China. The upcoming May 5 OPEC+ meeting may also bring forward production hikes, adding further pressure on prices.
Technical Overview
Moving Averages
- Exponential
- MA 10: 61.81 | Negative crossover | Bearish
- MA 20: 63.00 | Negative crossover | Bearish
- MA 50: 65.70 | Negative crossover | Bearish
- Simple
- MA 10: 62.35 | Negative crossover | Bearish
- MA 20: 62.49 | Negative crossover | Bearish
- MA 50: 66.23 | Negative crossover | Bearish
Indicators
- RSI: 36.18 | Sell zone | Bearish
- Stochastic Oscillator: 44.81 | Sell zone | Negative
Support and Resistance Levels
- Resistance: R1 – 71.99 | R2 – 73.55
- Support: S1 – 66.94 | S2 – 65.38
Market Outlook
- Overall Sentiment: Bearish
- Market Direction: Sell
Trade Suggestion
- Limit Sell: 60.87
- Take Profit: 58.70
- Stop Loss: 62.41
Natural Gas
Natural Gas Futures Test Key Resistance at $3.402
Natural gas is attempting a breakout above the $3.402 resistance level while trading around $3.390. Price action remains restricted by a descending trendline, with a confirmed breakout likely to lead toward targets at $3.517, $3.620, and $3.746.
The 50 EMA below the price suggests a short-term bullish bias, while the 200 EMA continues to reflect longer-term bearish pressure. Until a decisive move above $3.40 occurs, downside risks remain intact.
Technical Overview

Moving Averages
- Exponential
- MA 10: 3.22 | Positive crossover | Bullish
- MA 20: 3.37 | Negative crossover | Bearish
- MA 50: 3.61 | Negative crossover | Bearish
- Simple
- MA 10: 3.14 | Positive crossover | Bullish
- MA 20: 3.39 | Negative crossover | Bearish
- MA 50: 3.85 | Negative crossover | Bearish
Indicators
- RSI: 42.40 | Neutral zone | Neutral
- Stochastic Oscillator: 40.23 | Neutral zone | Positive
Support and Resistance Levels
- Resistance: R1 – 4.77 | R2 – 5.07
- Support: S1 – 3.78 | S2 – 3.48
Market Outlook
- Overall Sentiment: Neutral
- Market Direction: Sell
Trade Suggestion
- Limit Sell: 3.45
- Take Profit: 3.16
- Stop Loss: 3.66
Other Commodity Market Movements
- Gold: Down 1.01% at $3,283.60
- Silver: Down 1.45% at $32.41
- Palladium: Down 0.53% at $931.61
- Platinum: Down 1.02% at $969.60
- Brent Crude: Down 0.70% at $62.57
- WTI Crude: Down 0.59% at $59.72
Key Economic Events to Watch Today
- AUD: CPI (YoY) (Q1)
- Forecast: 2.3% | Previous: 2.4% | Time: 07:00
- CNY: Manufacturing PMI (Apr)
- Forecast: 49.7 | Previous: 50.5 | Time: 07:00
- EUR: German GDP (QoQ) (Q1)
- Forecast: 0.2% | Previous: –0.2% | Time: 13:00
- EUR: German CPI (MoM) (Apr)
- Forecast: 0.3% | Previous: 0.3% | Time: 17:30
- USD: ADP Nonfarm Employment Change (Apr)
- Forecast: 114K | Previous: 155K | Time: 17:45
- USD: GDP (QoQ) (Q1)
- Forecast: 0.2% | Previous: 2.4% | Time: 18:00
- USD: Core PCE Price Index (YoY) (Mar)
- Forecast: 2.6% | Previous: 2.8% | Time: 19:30