

This week’s commodity market outlook reflects the impact of geopolitical unrest, evolving international trade dynamics, and critical economic indicators from the United States and the United Kingdom. Precious metals like gold and silver remain influenced by global risk sentiment and central bank policy cues, while energy markets react to supply risks and demand outlooks. US and UK traders will closely monitor CPI figures, GDP reports, and remarks from key central bank officials for directional clarity.
KEY HIGHLIGHTS
- Gold stalls despite geopolitical tension, focus shifts to trade talks.
- Silver volatile as Fed signals and inflation data drive uncertainty.
- Oil rises on US-China hopes, capped by demand concerns.
- Natural gas steadies as weather and storage updates guide price.
Gold (XAU/USD) – Bullish Momentum Faces Resistance as Trade Sentiment Shifts
Gold prices opened the week with strength, climbing nearly 3% on Monday as geopolitical tensions intensified. Safe-haven demand was fueled by a missile attack near Israel’s Ben Gurion Airport and renewed concerns over India-Pakistan relations. However, sentiment shifted midweek following a trade agreement between the US and UK, which improved global risk appetite.
US & UK Market Relevance:
- US traders reacted to President Biden’s remarks on potential tariff relief with China, weighing on gold.
- UK market optimism rose after a bilateral trade pact with the US, impacting safe-haven positioning.
- Upcoming US CPI and UK GDP data could significantly influence gold’s direction.
Technical Overview:

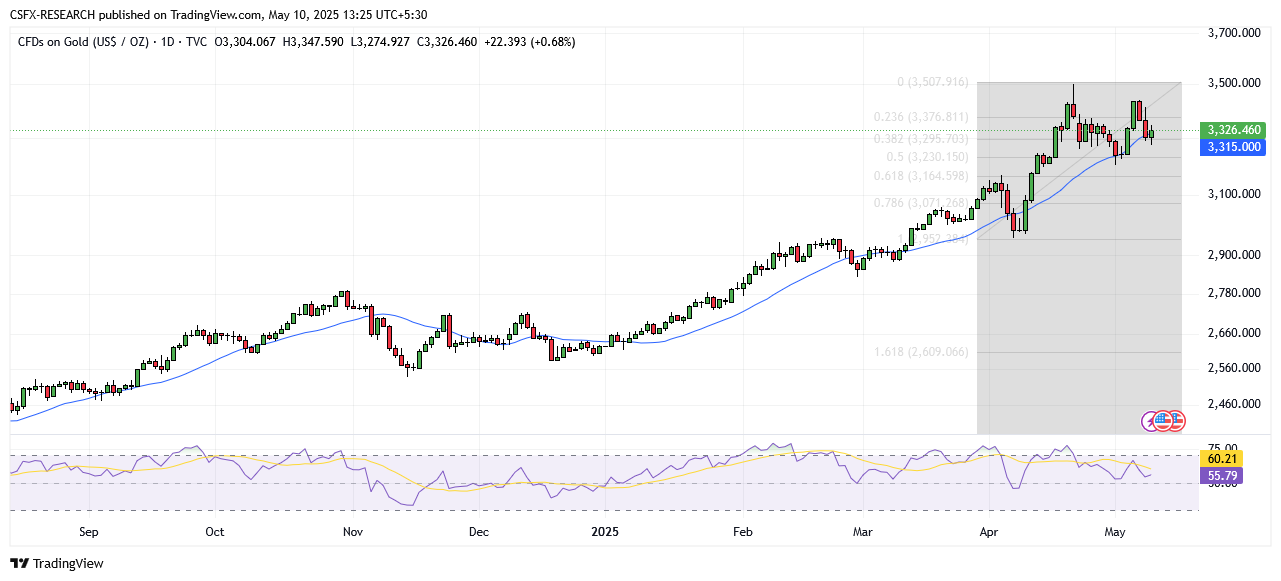
Moving Averages:
Exponential (EMA)
- EMA 10: 3322.13 – Bullish
- EMA 20: 3284.63 – Bullish
- EMA 50: 3157.37 – Bullish
Simple (SMA)
- SMA 10: 3318.75 – Bullish
- SMA 20: 3314.50 – Bullish
- SMA 50: 3129.85 – Bullish
Momentum Indicators:
- RSI: 55.93 – Bullish
- Stochastic Oscillator: 43.54 – Neutral
Key Levels:
- Resistance: R1: 3455.95 | R2: 3584.20
- Support: S1: 3040.74 | S2: 2912.49
Overall Sentiment: Bullish
Market Direction: Buy
Trade Suggestion: Limit Buy at 3273.00 | Take Profit at 3369.50 | Stop Loss at 3225.30
Silver (XAG/USD) – Fed Signals Keep Market Volatile
Silver experienced a volatile week as traders balanced safe-haven interest with a stronger US dollar driven by solid economic data. The metal struggled to maintain gains despite geopolitical uncertainty, with gold outperforming as a preferred hedge.
US & UK Market Relevance:
- US Treasury yields climbed, reducing demand for non-yielding assets like silver.
- UK traders will monitor inflation and GDP trends to assess potential rate moves from the Bank of England.
Technical Overview:
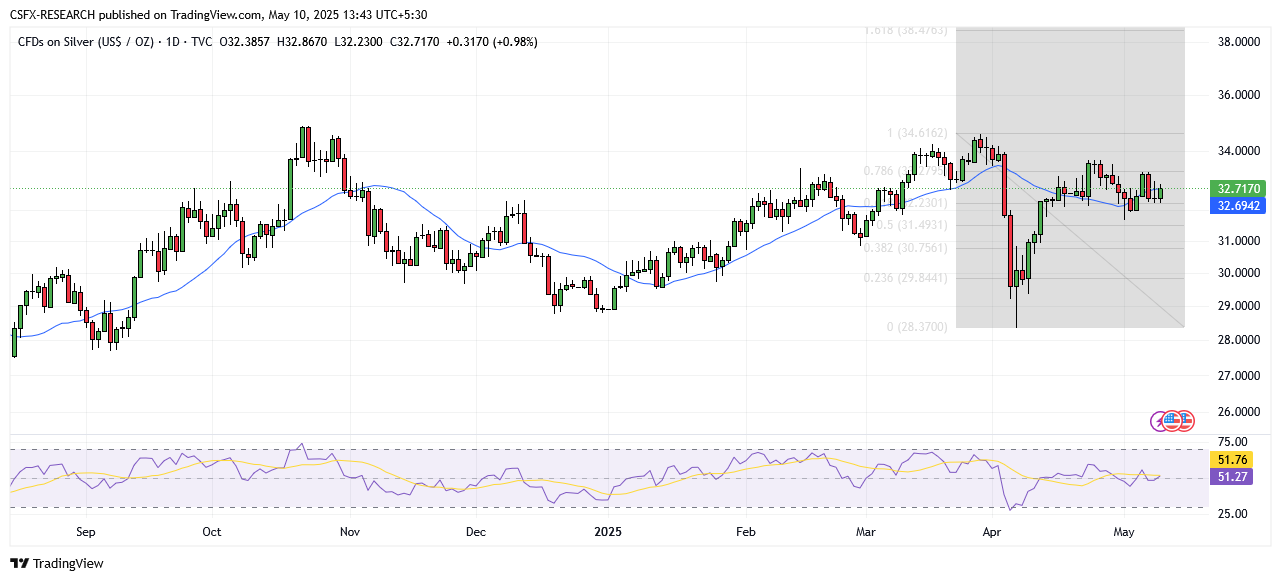
Moving Averages:
Exponential (EMA)
- EMA 10: 32.61 – Bullish
- EMA 20: 32.67 – Bullish
- EMA 50: 31.74 – Bullish
Simple (SMA)
- SMA 10: 32.61 – Bullish
- SMA 20: 32.59 – Bullish
- SMA 50: 32.04 – Bullish
Momentum Indicators:
- RSI: 51.12 – Bullish
- Stochastic Oscillator: 34.85 – Neutral
Key Levels:
- Resistance: R1: 33.15 | R2: 34.33
- Support: S1: 32.29 | S2: 31.60
Overall Sentiment: Neutral
Market Direction: Buy
Trade Suggestion: Limit Buy at 32.64 | Take Profit at 33.20 | Stop Loss at 32.40
Crude Oil – Trade Optimism Supports Recovery
Crude oil closed the week with a near-2% gain, driven by optimism surrounding US-China trade talks and fresh progress on a US-UK trade deal. However, persistent economic uncertainty in China tempered enthusiasm, highlighting the fragile nature of global oil demand recovery.
US & UK Market Relevance:
- EIA inventory reports and remarks from Fed Chair Powell will be key for US crude traders.
- UK oil traders focus on OPEC updates and UK GDP data for insights into European energy demand.
Technical Overview:
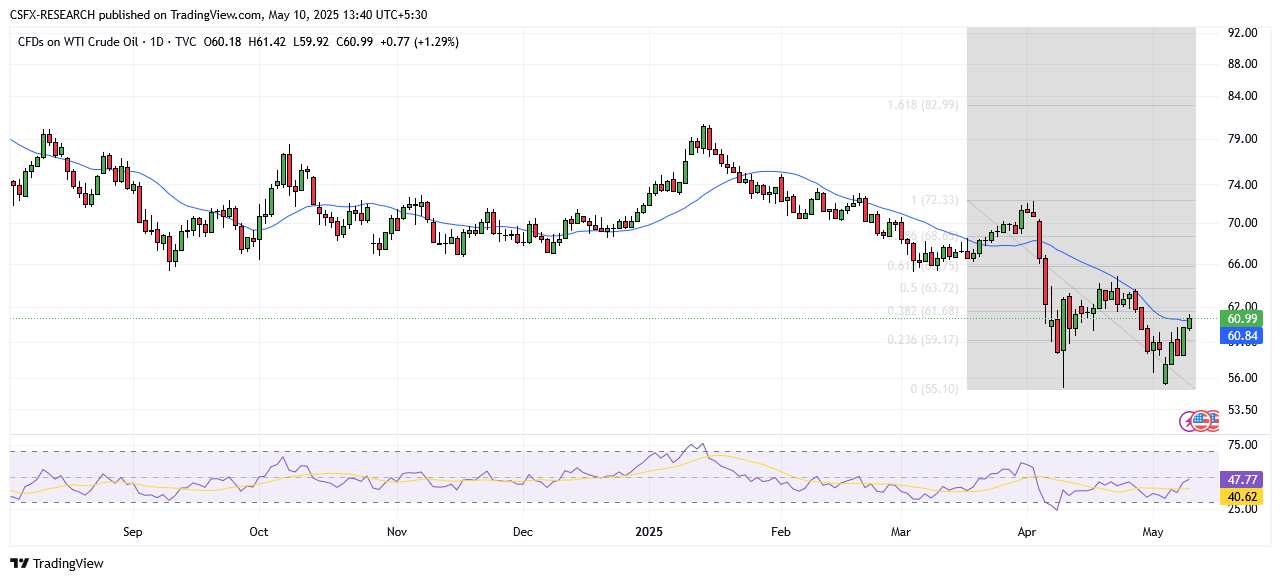
Moving Averages:
Exponential (EMA)
- EMA 10: 59.87 – Bullish
- EMA 20: 60.99 – Bullish
- EMA 50: 64.04 – Bearish
Simple (SMA)
- SMA 10: 59.30 – Bullish
- SMA 20: 60.98 – Bullish
- SMA 50: 64.59 – Bearish
Momentum Indicators:
- RSI: 47.69 – Neutral
- Stochastic Oscillator: 46.61 – Neutral
Key Levels:
- Resistance: R1: 68.40 | R2: 72.45
- Support: S1: 55.30 | S2: 51.25
Overall Sentiment: Neutral
Market Direction: Sell
Trade Suggestion: Limit Sell at 61.70 | Take Profit at 58.46 | Stop Loss at 63.93
Natural Gas – Demand Outlook Hinges on Weather & Storage
Natural gas prices moved modestly, reflecting changing weather models and consistent storage builds. Warmer-than-expected conditions early in the week capped demand, but cooler forecasts in key US regions provided late support.
US & UK Market Relevance:
- US traders will track EIA storage data and short-term weather shifts.
- UK energy markets, highly sensitive to LNG flows, may see volatility tied to US export dynamics.
Technical Overview:
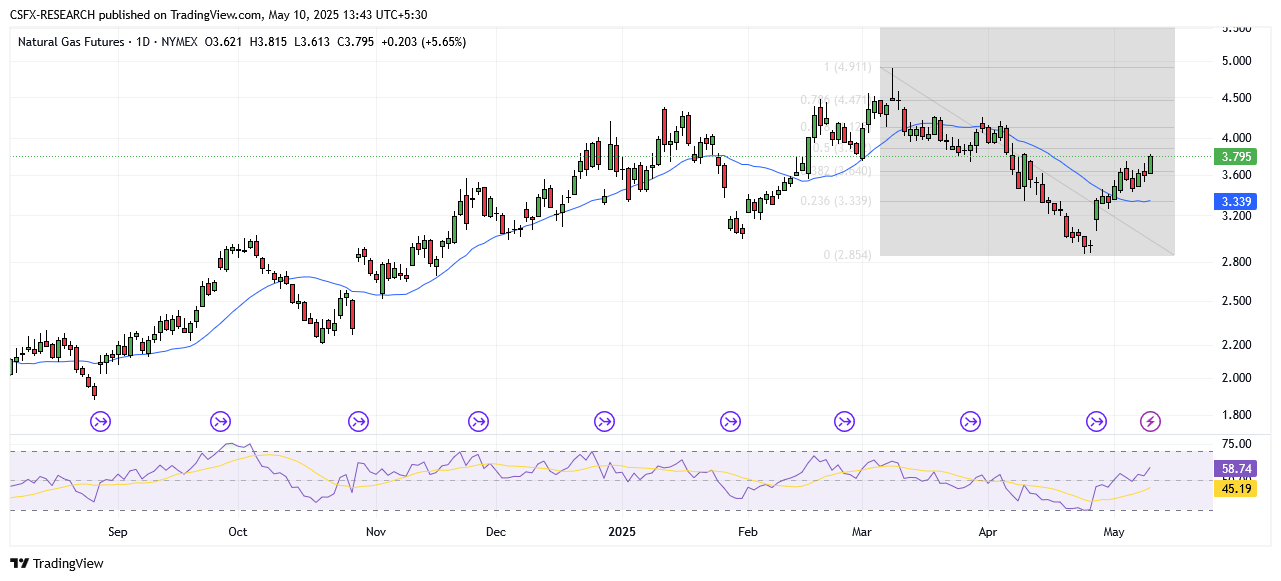
Moving Averages:
Exponential (EMA)
- EMA 10: 3.4627 – Bullish
- EMA 20: 3.4485 – Bullish
- EMA 50: 3.5873 – Bullish
Simple (SMA)
- SMA 10: 3.4291 – Bullish
- SMA 20: 3.3089 – Bullish
- SMA 50: 3.7550 – Bearish
Momentum Indicators:
- RSI: 58.25 – Bullish
- Stochastic Oscillator: 89.74 – Neutral
Key Levels:
- Resistance: R1: 3.9384 | R2: 4.2443
- Support: S1: 2.9483 | S2: 2.6424
Overall Sentiment: Bullish
Market Direction: Buy
Trade Suggestion: Limit Buy at 3.69 | Take Profit at 3.97 | Stop Loss at 3.55
Additional Commodity Market Movements
- Gold: +0.68% at 3326.46
- Silver: +0.98% at 32.71
- Palladium: +0.44% at 975.22
- Platinum: +1.4% at 997.62
- Brent Crude: +1.14% at 63.88
- WTI Crude: +1.33% at 61.05
Key Economic Events This Week (USA & UK Focus)
Tuesday:
- US Core CPI (MoM) – April
- US CPI (YoY) – April
Wednesday:
- US Crude Oil Inventories
Thursday:
- UK GDP (QoQ, YoY, MoM) – Q1
- US Core Retail Sales (MoM) – April
- US Initial Jobless Claims
- US PPI (MoM) – April
- US Retail Sales (MoM) – April
- Fed Chair Powell Speaks
- Friday:
- Japan GDP (QoQ) – Q1
Frequently Asked Questions
1. Why did gold prices drop midweek despite geopolitical risks?
Because positive developments in US-UK and US-China trade negotiations boosted risk appetite, reducing the demand for safe-haven assets like gold.
2. What will most influence silver prices this week?
US inflation data and Fed speeches—softer CPI could support silver, while hawkish Fed tone may pressure it lower.
3. How does UK GDP data affect energy markets?
Strong UK GDP growth signals robust energy demand, which can support prices in crude oil and natural gas markets.
4. What is the significance of EIA inventory reports for crude oil?
They provide insight into US supply levels. Rising inventories can pressure oil prices, while declines often support a bullish outlook.
5. How can weather changes in the US impact natural gas?
Temperature shifts directly influence demand for heating or cooling, making natural gas prices highly sensitive to forecast updates.
Would you like me to prepare a downloadable PDF version of this report or create visuals for social media use?