

This week, commodity markets saw significant volatility, influenced by geopolitical tensions, Federal Reserve (Fed) policies, and shifting supply-demand dynamics. Gold and silver surged as investors sought safe-haven assets, while crude oil faced downward pressure due to economic uncertainty. Meanwhile, natural gas struggled amid mild weather and fluctuating demand.
KEY HIGHLIGHTS
Gold Surges as Bulls Defy Overbought Signals
Gold (XAU/USD) continued its unstoppable rally, reaching a new all-time high above $2,940. The surge was fueled by heightened geopolitical concerns and economic uncertainty, which drove investors toward safe-haven assets.
Key Market Drivers:
- Geopolitical Uncertainty: Rising tensions, particularly regarding U.S. trade policies and global conflicts, boosted demand for gold.
- Federal Reserve Expectations: Investors closely monitored Fed Chairman Jerome Powell’s remarks, which briefly triggered a pullback in gold prices. However, the overall sentiment remained bullish.
- Inflation & Rate Speculation: Market participants are pricing in a 20% probability of a Fed rate cut in May, supporting gold’s uptrend.
Technical Analysis:


- Moving Averages:
- Exponential: MA10 – 2871.27 (Bullish), MA20 – 2825.83 (Bullish), MA50 – 2750.10 (Bullish)
- Simple: MA10 – 2875.63 (Bullish), MA20 – 2817.14 (Bullish), MA50 – 2717.19 (Bullish)
- RSI: 65.65 (Bullish – Buy Zone)
- Stochastic Oscillator: 81.84 (Neutral – Overbought)
- Resistance Levels: R1 – 2820.47, R2 – 2868.24
- Support Levels: S1 – 2665.83, S2 – 2618.06
Trade Suggestion:
Limit Buy: 2859.35 | Take Profit: 2923.27 | Stop Loss: 2823.47
Silver Gains as Geopolitical Uncertainty Drives Demand
Silver (XAG/USD) extended its bullish momentum, surging past $32.65 before retreating slightly. Weak U.S. retail sales data and growing geopolitical risks further fueled investor interest in silver.
Key Market Drivers:
- Safe-Haven Appeal: Geopolitical tensions and weaker U.S. economic data supported silver prices.
- Federal Reserve Speculations: Despite high inflation, weak retail sales led traders to reassess the Fed’s future rate-cut expectations.
- Industrial Demand: Continued demand from industrial sectors, including renewable energy and electronics, provided additional support.
Technical Analysis:
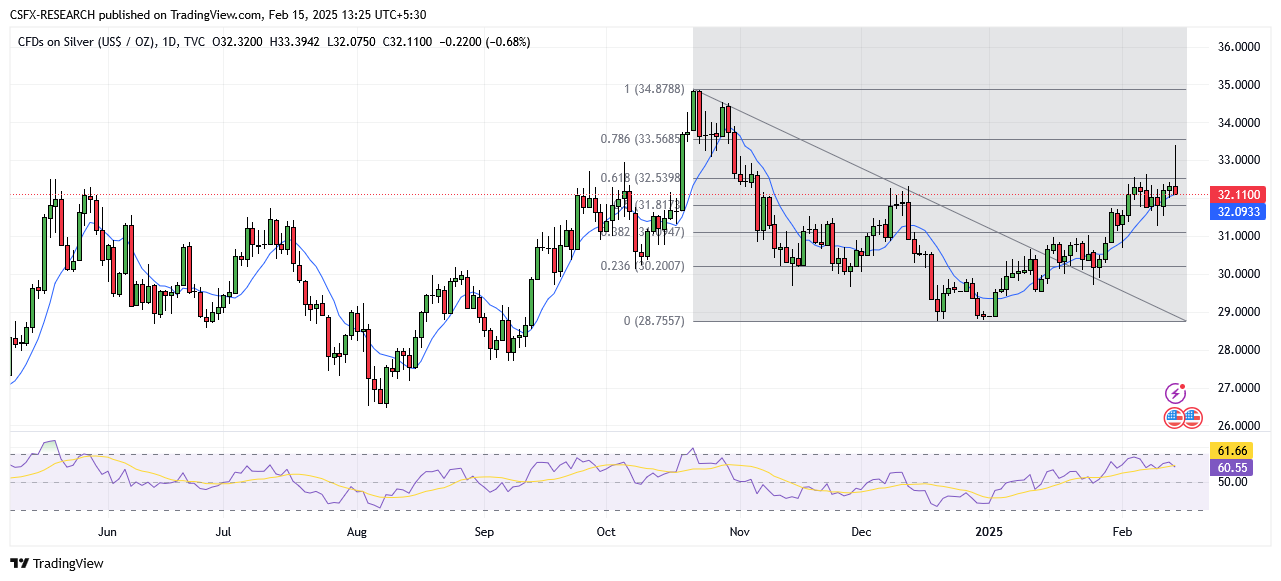
- Moving Averages:
- Exponential: MA10 – 32.01 (Bullish), MA20 – 31.35 (Bullish), MA50 – 30.62 (Bullish)
- Simple: MA10 – 31.88 (Bullish), MA20 – 31.48 (Bullish), MA50 – 30.99 (Bullish)
- RSI: 60.36 (Bullish – Buy Zone)
- Stochastic Oscillator: 69.91 (Neutral – Buy Zone)
- Resistance Levels: R1 – 32.53, R2 – 33.72
- Support Levels: S1 – 31.34, S2 – 30.47
Trade Suggestion:
Limit Buy: 31.83 | Take Profit: 32.89 | Stop Loss: 31.22
Crude Oil Declines Amid Supply Risks and Demand Uncertainty
Crude oil prices saw a weekly decline as hopes for a Russia-Ukraine peace deal and easing U.S. tariffs raised supply expectations. Brent crude settled at $74.74 per barrel, while West Texas Intermediate (WTI) dropped to $70.74.
Key Market Drivers:
- Geopolitical Developments: The potential for a Russia-Ukraine resolution raised the possibility of lifted sanctions, increasing oil supply.
- Federal Reserve Policy: Concerns over higher interest rates impacting global economic growth weighed on oil demand.
- OPEC+ Adjustments: OPEC’s supply strategies will play a critical role in future price movements.
Technical Analysis:
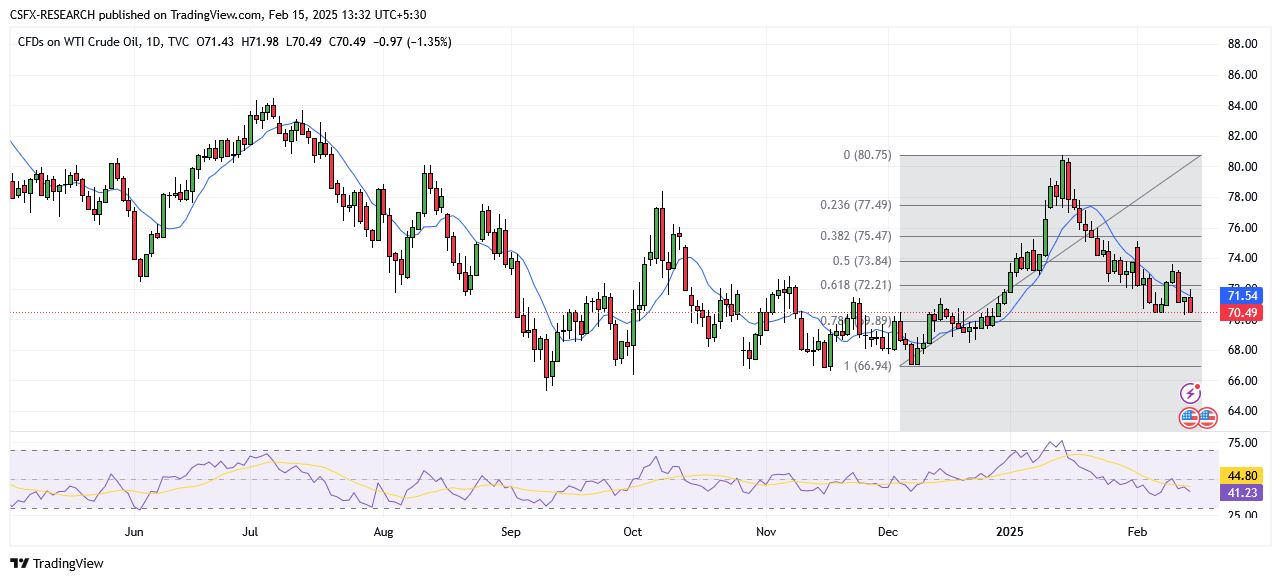
- Moving Averages:
- Exponential: MA10 – 71.88 (Bearish), MA20 – 72.60 (Bearish), MA50 – 72.60 (Bearish)
- Simple: MA10 – 71.66 (Bearish), MA20 – 73.02 (Bearish), MA50 – 72.58 (Bearish)
- RSI: 41.38 (Bearish – Sell Zone)
- Stochastic Oscillator: 16.93 (Neutral – Sell Zone)
- Resistance Levels: R1 – 78.85, R2 – 80.97
- Support Levels: S1 – 71.99, S2 – 69.87
Trade Suggestion:
Limit Sell: 71.20 | Take Profit: 69.86 | Stop Loss: 72.05
Natural Gas Struggles Amid Mild Weather and Demand Concerns
Natural gas prices remained under pressure due to mild weather forecasts and subdued demand. While temporary supply disruptions provided brief support, the overall outlook remained bearish.
Key Market Drivers:
- Weather Patterns: Above-average temperatures in key U.S. regions reduced heating demand.
- LNG Exports & Global Demand: Stability in U.S. LNG exports helped limit further declines, though weaker demand from Europe and Asia remained a concern.
- Technical Indicators: The 20-Day MA crossing below the 50-Day MA signaled potential downside risks.
Technical Analysis:
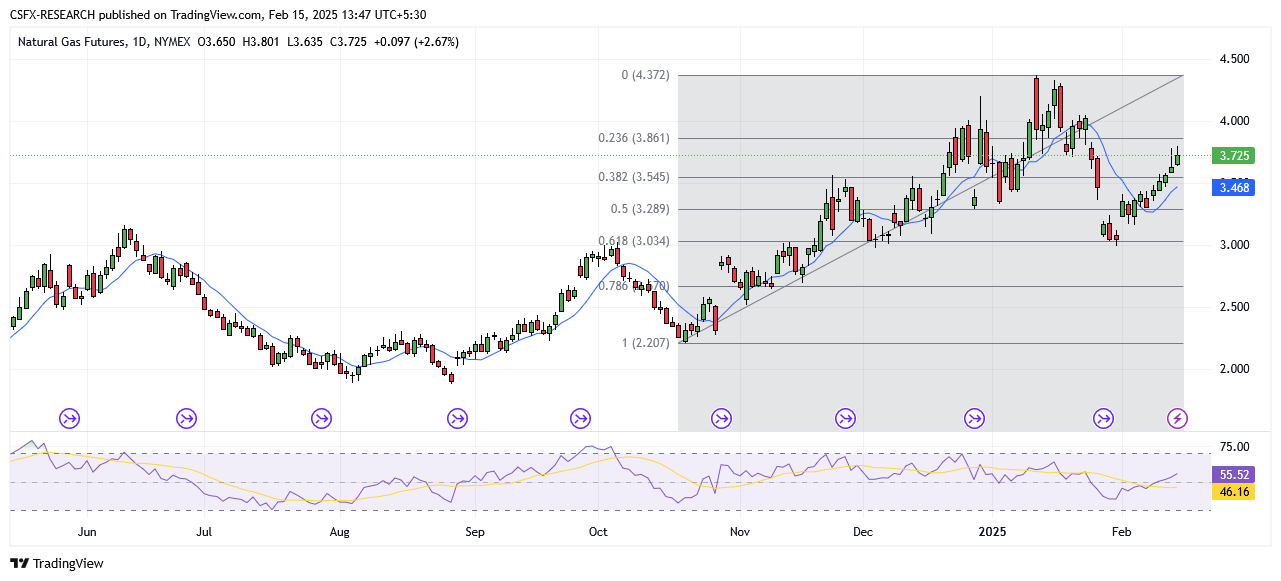
- Moving Averages:
- Exponential: MA10 – 3.70 (Bullish), MA20 – 3.68 (Bullish), MA50 – 3.52 (Bullish)
- Simple: MA10 – 3.66 (Bullish), MA20 – 3.66 (Bullish), MA50 – 3.58 (Bullish)
- RSI: 57.99 (Bullish – Buy Zone)
- Stochastic Oscillator: 79.14 (Neutral – Buy Zone)
- Resistance Levels: R1 – 4.08, R2 – 4.33
- Support Levels: S1 – 3.25, S2 – 3.00
Trade Suggestion:
Limit Buy: 3.66 | Take Profit: 3.91 | Stop Loss: 3.53
Elsewhere in the Commodity Market:
- Gold: Down (1.54%) at $2882.08
- Silver: Down (0.68%) at $32.10
- Palladium: Down (3.4%) at $962.23
- Platinum: Down (1.99%) at $977.05
- Brent Crude: Down (0.9%) at $74.51
- WTI Crude: Down (1.23%) at $70.61
Key Economic Events & Data Releases This Week:
- (JPY) GDP (Q4) – Monday
- (AUD) RBA Interest Rate Decision – Tuesday
- (NZD) RBNZ Interest Rate Decision – Wednesday
- (GBP) CPI (YoY) – Wednesday
- (USD) FOMC Meeting Minutes – Thursday
- (USD) Initial Jobless Claims – Thursday
- (GBP) Retail Sales (MoM) – Friday
Stay tuned for further market updates and insights! 📊📈