

KEY HIGHLIGHTS
- Oil Prices Drop Amid Fed Signals, Demand Concerns.
- Gold Prices Slide On Dollar Strength And Yields.
- Natural Gas Gains Amid Strong Demand, Storage Trends.
- Coffee Prices Reach All-Time High In December 2024.
Introduction
Crude oil inventories in the U.S. fell by 934,000 barrels in the second week of December, falling short of market expectations. However, gasoline stocks rose by 2.348 million barrels, contrasting sharply with a substantial drop in distillate fuel stocks. Meanwhile, the Energy Information Administration (EIA) reduced its global oil demand growth forecast for 2025 by 300,000 barrels per day (bpd), citing weaker economic activity in China and North America.
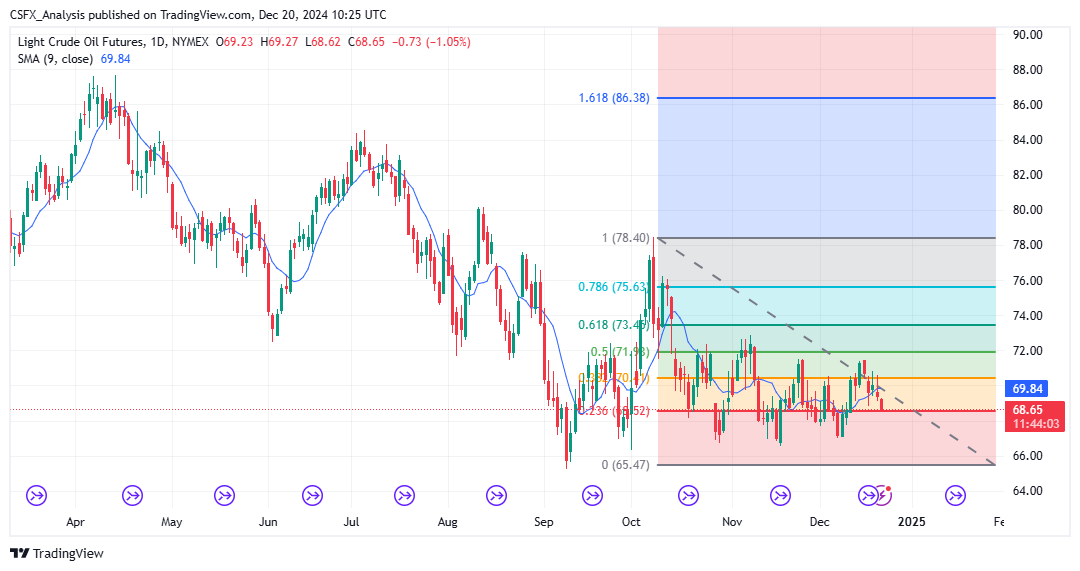
Oil Prices Drift Lower Amid Fed Jitters and Demand Concerns Oil prices dropped in Asian trading on Friday, heading for weekly losses. Concerns over a hawkish Federal Reserve and a potential slowdown in global demand weighed heavily on crude markets. The stronger U.S. dollar, which surged to a two-year high, further pressured oil prices, making the commodity more expensive for non-dollar holders.
Brent crude futures for February delivery fell 0.5% to $72.49 per barrel, while West Texas Intermediate (WTI) crude futures declined 0.5% to $69.07 per barrel.
Technical Overview of Crude Oil:

- Exponential Moving Averages (EMA):
- MA 10: $69.50 | Negative Crossover | Bearish
- MA 20: $69.43 | Negative Crossover | Bearish
- MA 50: $69.97 | Negative Crossover | Bearish
- Simple Moving Averages (SMA):
- MA 10: $69.68 | Negative Crossover | Bearish
- MA 20: $69.15 | Negative Crossover | Bearish
- MA 50: $69.65 | Negative Crossover | Bearish
- Relative Strength Index (RSI): 45.96 | Neutral Zone | Neutral
- Stochastic Oscillator: 52.47 | Neutral Zone | Neutral
- Resistance Levels: R1: $71.59 | R2: $73.07
- Support Levels: S1: $66.80 | S2: $65.32
Suggested Trade:
- Limit Buy: $68.63
- Take Profit: $65.32
- Stop Loss: $75.20
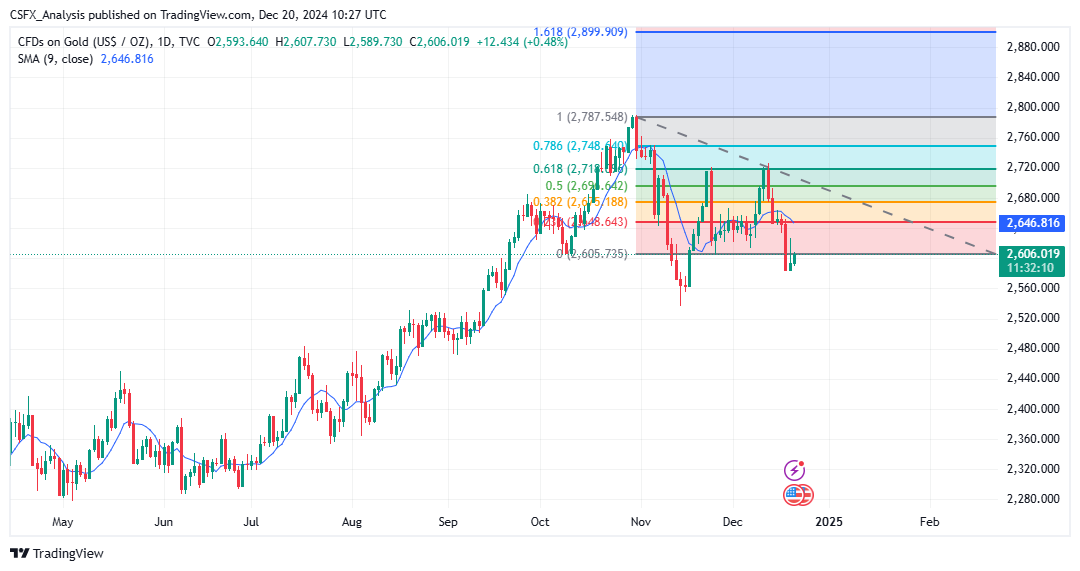
Japanese Gold Prices Slide Amid Dollar Strength Japanese gold prices mirrored global trends, falling under pressure from a robust U.S. dollar and higher Treasury yields. The Federal Reserve’s hawkish outlook, with fewer than expected rate cuts in 2025, dampened sentiment in precious metals markets.
Spot gold steadied near a one-month low at $2,596.82 per ounce, while gold futures for February inched up 0.1% to $2,610.30 per ounce. Spot prices were down nearly 2% for the week, reflecting the strength of the dollar, which hit a one-year high.
Technical Overview of Gold:
- Exponential Moving Averages (EMA):
- MA 10: $2,630.61 | Negative Crossover | Bearish
- MA 20: $2,641.06 | Negative Crossover | Bearish
- MA 50: $2,640.61 | Negative Crossover | Bearish
- Simple Moving Averages (SMA):
- MA 10: $2,648.19 | Negative Crossover | Bearish
- MA 20: $2,642.92 | Negative Crossover | Bearish
- MA 50: $2,668.55 | Negative Crossover | Bearish
- Relative Strength Index (RSI): 43.17 | Neutral Zone | Neutral
- Stochastic Oscillator: 8.15 | Neutral Zone | Neutral
- Resistance Levels: R1: $2,735.87 | R2: $2,789.05
- Support Levels: S1: $2,563.71 | S2: $2,510.53
Suggested Trade:
- Limit Buy: $2,606.06
- Take Profit: $2,510.53
- Stop Loss: $2,875.28
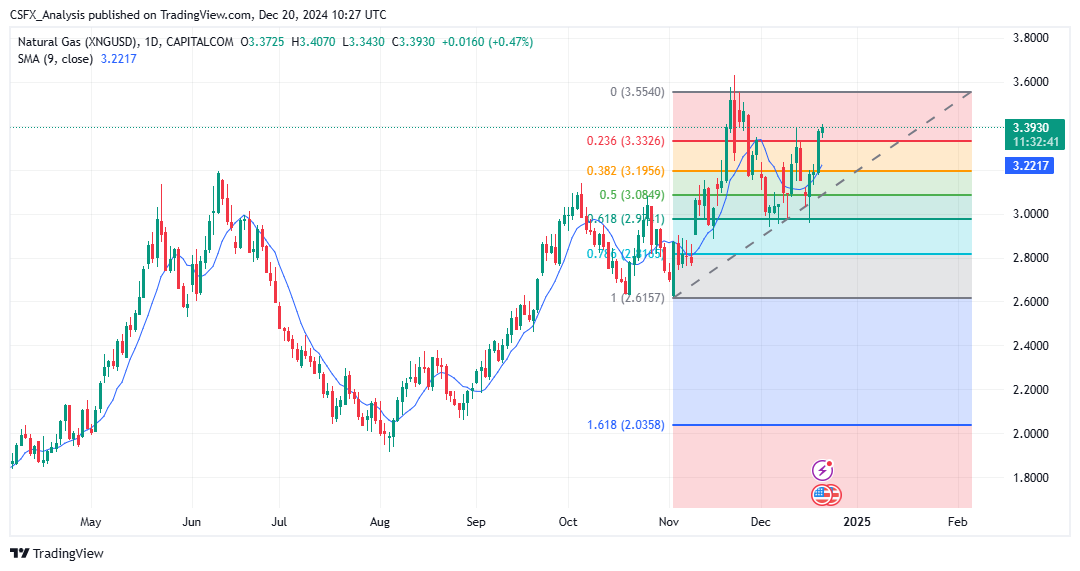
Natural Gas Prices Surge Amid Robust Demand Natural gas prices showed signs of consolidation, trading at $3.34, down 0.83%. While the 50 EMA on the 4-hour chart indicated near-term bearish sentiment, robust demand and storage levels fueled bullish momentum. Immediate resistance lies at $3.57, with support levels at $3.42 and $3.25. A sustained breakout above $3.57 could propel prices towards $3.95.
Technical Overview of Natural Gas:
- Exponential Moving Averages (EMA):
- MA 10: $3.22 | Positive Crossover | Bullish
- MA 20: $3.10 | Positive Crossover | Bullish
- MA 50: $2.86 | Positive Crossover | Bullish
- Simple Moving Averages (SMA):
- MA 10: $3.21 | Positive Crossover | Bullish
- MA 20: $3.10 | Positive Crossover | Bullish
- MA 50: $2.76 | Positive Crossover | Bullish
- Relative Strength Index (RSI): 66.33 | Neutral Zone | Neutral
- Stochastic Oscillator: 88.32 | Neutral Zone | Neutral
- Resistance Levels: R1: $3.29 | R2: $3.57
- Support Levels: S1: $2.39 | S2: $2.12
Suggested Trade:
- Limit Buy: $3.43
- Take Profit: $3.56
- Stop Loss: $1.68
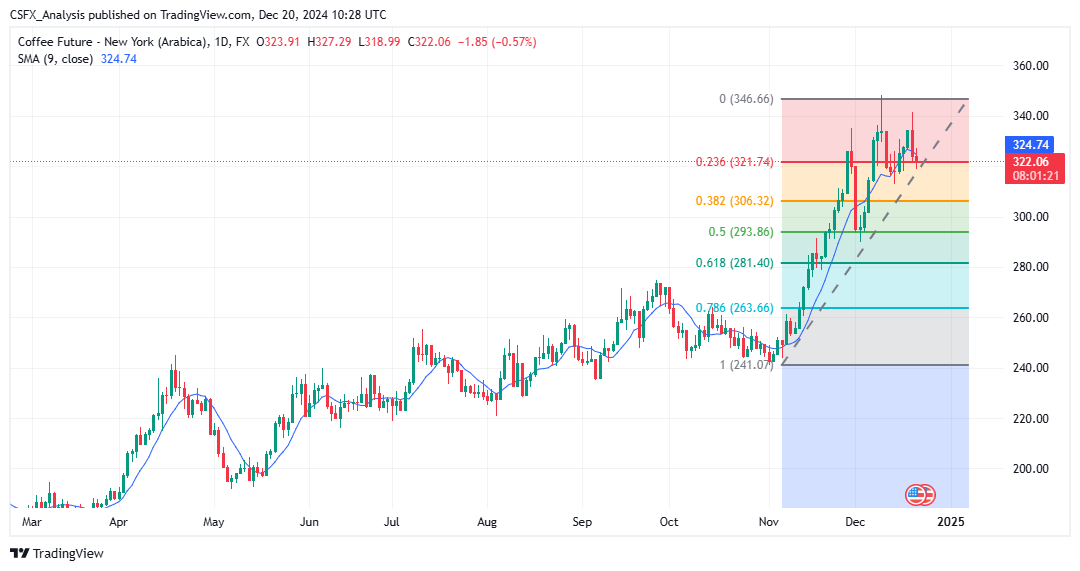
Coffee Prices Hit All-Time Highs Coffee prices surged to an all-time high of 349.58 USd/Lbs in December 2024, marking a 71.33% year-to-date increase. The sharp rise highlights the strong bullish momentum in the commodity.
Technical Overview of Coffee:
- Exponential Moving Averages (EMA):
- MA 10: $143.41 | Negative Crossover | Bearish
- MA 20: $183.63 | Negative Crossover | Bearish
- MA 50: $161.54 | Negative Crossover | Bearish
- Simple Moving Averages (SMA):
- MA 10: $144.52 | Negative Crossover | Bearish
- MA 20: $247.46 | Negative Crossover | Bearish
- MA 50: $142.80 | Negative Crossover | Bearish
- Relative Strength Index (RSI): 41.50 | Neutral Zone | Neutral
- Stochastic Oscillator: 0.00 | Neutral Zone | Neutral
- Resistance Levels: R1: $74.29 | R2: $75.29
- Support Levels: S1: $71.04 | S2: $70.04
Suggested Trade:
- Limit Buy: $67.59
- Take Profit: $70.04
- Stop Loss: $76.85
Conclusion Oil and Japanese gold markets are facing downward pressure amid macroeconomic uncertainties and a hawkish Federal Reserve. Conversely, natural gas and coffee continue to show resilience and bullish trends. Traders should remain cautious, leveraging technical insights and market updates to make informed decisions.