

U.S. Stock Futures Decline Ahead of Fed Minutes.
Introduction
As traders return to their desks after the Fourth of July holiday, the U.S. stock market faces a decline in futures. The focus is on the upcoming release of the Federal Reserve’s meeting minutes and statistics from China’s services sector.
U.S. Market Futures Respond to Independence Day Holiday
Following the celebration of Independence Day, U.S. market futures experience a slight decline. Wall Street gears up for a post-holiday resumption, while investors eagerly await the release of the Federal Reserve’s meeting minutes from June.
Federal Reserve to Shed Light on Interest Rate Decisions
In an effort to provide insights into the Federal Reserve’s decision to maintain interest rates steady, the central bank will unveil the minutes from its June policy meeting. This disclosure aims to offer additional context regarding the monetary policy choices made.
The Federal Open Market Committee, during its most recent meeting, chose to keep borrowing costs within the current target range of 5% to 5.25%. However, officials hinted at the likelihood of two more rate increases in 2023, with one potentially taking place at the Fed’s upcoming meeting later this month.
Focus on Factory Orders in the United States
Market observers turn their attention to factory orders within the United States. Forecasts predict a rise of 0.8% in May, indicating an improvement from the previous month’s increase of 0.4% in April. This data contributes to the assessment of economic growth and overall market sentiment.
S&P 500 Technical Analysis: Daily Chart
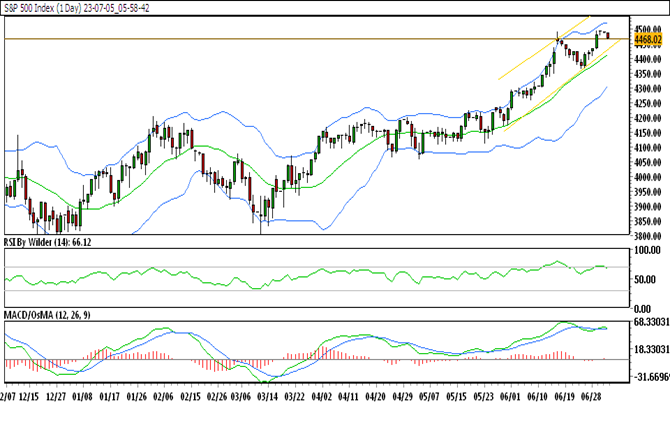
When analyzing the daily chart of the S&P 500, the following observations can be made:
- The S&P 500 is currently trading within an upward channel, suggesting a positive trend.
- It is positioned above the 20-day and 50-day Simple Moving Averages (SMA), indicating bullish sentiment.
- The Relative Strength Index (RSI) indicates a buying zone, further supporting a bullish outlook.
- The Stochastic indicator implies a lack of clear trend direction at the moment.
Key Resistance and Support Levels
In terms of resistance and support, the immediate levels to watch for the S&P 500 are as follows:
- Immediate Resistance: 4490.34
- Immediate Support: 4468.13
These levels serve as important thresholds that may influence the short-term price action of the S&P 500 index.
How to Trade the S&P 500 This Week
Given the current market conditions, here’s a trading perspective for the S&P 500:
The S&P 500 has displayed an upward trajectory, forming a pattern of higher highs. However, with a recent break below the previous day’s low and the index currently trading lower, it approaches a crucial support zone. A further decline is possible if this support zone is breached.
Trade Suggestion
- Entry Point: Sell at 4465.52
- Target: 4436.78
- Stop Loss: 4491.65
This trade suggestion aims to take advantage of a potential downside move in the S&P 500.
Conclusion
As U.S. market futures decline following the Independence Day holiday, investors await the release of the Federal Reserve’s meeting minutes. The insights provided by these minutes, along with factory order data, contribute to a better understanding of market conditions and potential trends. Traders keep a close eye on technical analysis indicators like resistance and support levels to make informed decisions. By considering these factors, market participants can navigate the evolving landscape of the U.S. stock market and adjust their trading strategies accordingly.