

Silver Technical Analysis: Weekly Chart
Introduction
We will analyze the technical aspects of silver trading based on the weekly chart. We’ll discuss key indicators such as the Simple Moving Averages (SMA), Relative Strength Index (RSI), and Stochastic. By examining these factors, we aim to provide insights into the current market conditions and potential future trends.
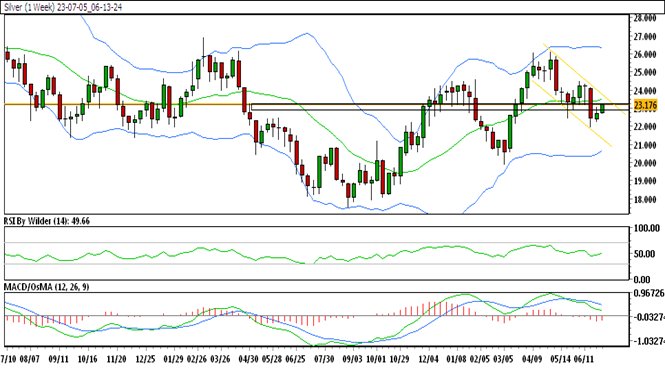
Down Channel and SMA
Silver Trading in a Down Channel
Silver Currently Below 5&20 SMA
The weekly chart shows that silver is currently trading within a down channel, indicating a bearish trend. Additionally, it is important to note that the price of silver is currently below both the 5-day and 20-day Simple Moving Averages (SMA). This suggests a negative sentiment in the market.
RSI and Stochastic
RSI in Buying Zone Indicates Bullishness
Stochastic Suggesting Downtrend
Despite the bearish channel and the position below the SMAs, the Relative Strength Index (RSI) is in the buying zone, which indicates a potential bullishness in the market. However, the Stochastic oscillator suggests a downtrend, highlighting the possibility of further price declines.
Support and Resistance Levels
Immediate Support at 22.86
Immediate Resistance at 23.24
Silver’s immediate support level on the weekly chart is observed at 22.86, whereas the resistance level stands at 23.24. These levels play a crucial role in determining the potential price movements.
Bullish Flag Formation
Bullish Flag-like Structure Forming
Crucial Resistance Level for Potential Gain
After a decline in price, silver on the weekly chart has reversed its direction and started to rise, forming a bullish flag-like structure. Currently, the price is trading near a critical resistance level. If this level is successfully broken, it could lead to further gains in the market.
Silver Technical Analysis: Daily Chart
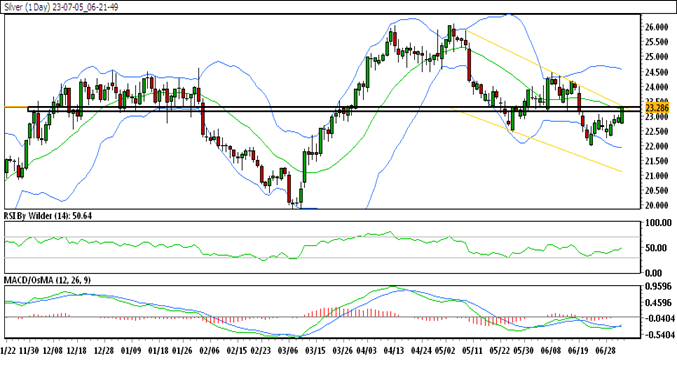
Down Channel and SMA
Silver Trading in a Down Channel
Silver Currently Above 5&20 SMA
Turning our attention to the daily chart, we observe that silver is also trading within a down channel. However, there is a notable difference as the price is currently above both the 5-day and 20-day SMAs. This indicates a slightly more positive sentiment compared to the weekly chart.
RSI and Stochastic
RSI in Buying Zone Indicates Bullishness
Stochastic Suggesting Uptrend
Similar to the weekly analysis, the RSI on the daily chart is in the buying zone, signaling potential bullishness. Additionally, the Stochastic oscillator suggests an uptrend, which aligns with the RSI analysis.
Support and Resistance Levels
Immediate Support at 23.04
Immediate Resistance at 23.26
On the daily chart, the immediate support level for silver is found at 23.04, while the resistance level is at 23.26. These levels should be closely monitored as they can significantly impact price movements.
Breakout and Upward Movement
Reversal and Upward Movement
Trading around Crucial Resistance Zone
The price of silver on the daily chart has reversed its previous downtrend and started to trade upward. Furthermore, it has successfully broken the previous day’s high and is currently trading around a critical resistance zone. If this zone is surpassed, there is a possibility of further upward movement.
Trade Suggestion
Trade Suggestion: Buying Opportunity
Based on the technical analysis, we present a trade suggestion for consideration:
- Buy at 23.26
- Take Profit at 23.73
- Stop Loss at 22.87
Please note that this trade suggestion is based on the analysis of technical indicators and should be carefully evaluated according to your own risk tolerance and trading strategy.