
US 30 YR. T-BOND PRICE TECHNICAL ANALYSIS: WEEKLY CHART
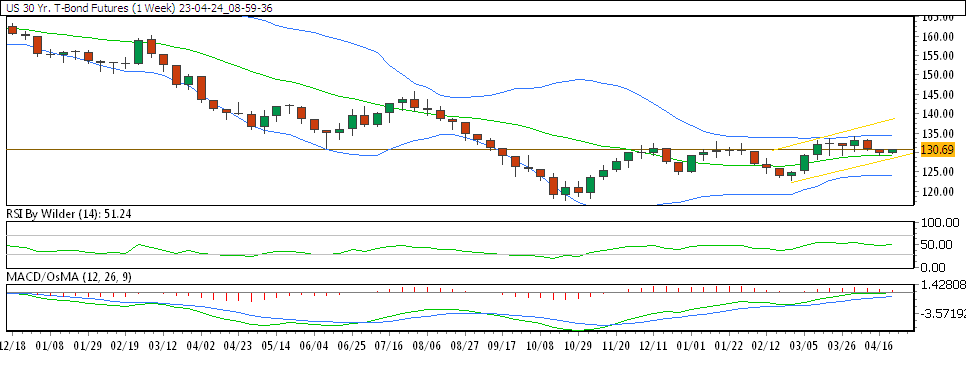
In the weekly chart, US 30 YR. T-BOND is trading in up channel.
US 30 YR. T-BOND is currently trading below 5&50 SMA.
RSI is in buying zone, which shows bullishness. Stochastic is suggesting down trend.
Its immediate support is at 129.14 & the resistance is at 131.16
US 30 YR. T-Bond Price was increasing but failed to break through the resistance zone; as a result, price reversed and is currently rising once more to break through the resistance zone. If price succeeds, we should expect upside.
US 30 YR. T-BOND PRICE TECHNICAL ANALYSIS: DAILY CHART
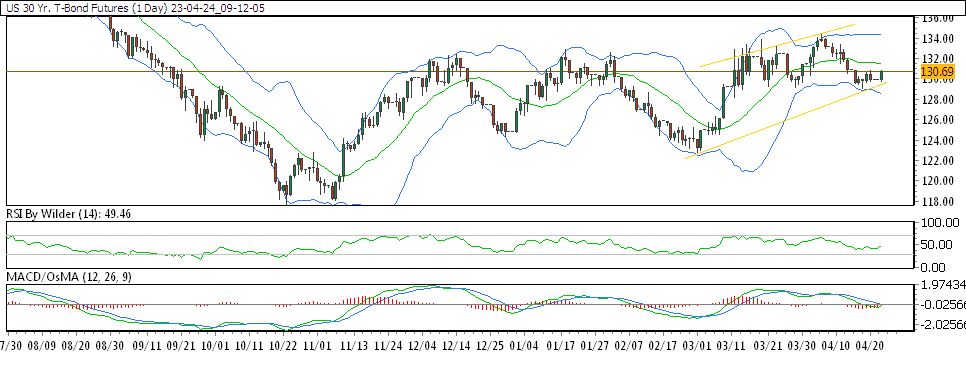
In the daily chart, US 30 YR. T-BOND is trading in up channel.
US 30 YR. T-BOND is currently trading above 5&50 SMA.
RSI is in buying zone, which shows bullishness & stochastic is suggesting up trend.
US 30 YR. T- BOND immediate support is at 129.82 & resistance is at 130.66
US 30 YR. T-Bond Price was increasing but failed to break through the resistance zone; as a result, price reversed and is currently rising once more to break through the resistance zone. If price succeeds, we should expect upside.