

USD/JPY Technical Analysis: Weekly Chart
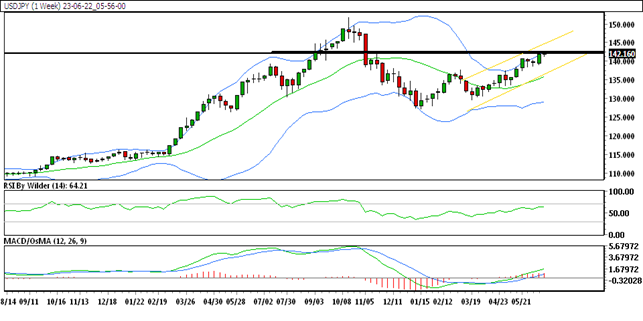
Trading in an Up Channel
The weekly chart of USD/JPY shows the pair trading within an upward channel, indicating an overall positive trend. This suggests potential opportunities for bullish trades.
Strong Position Above SMA
USD/JPY is currently trading above all Simple Moving Averages (SMA) on the weekly chart. This reinforces the bullish sentiment and supports the possibility of further upside movement.
Bullish Signals from RSI and Stochastic
The Relative Strength Index (RSI) on the weekly chart is in the buying zone, indicating bullishness in the market. Additionally, the Stochastic oscillator suggests an upward trend, further supporting the positive outlook for USD/JPY.
- Immediate support: 141.05
- Resistance level: 142.353
USD/JPY Technical Analysis: Daily Chart
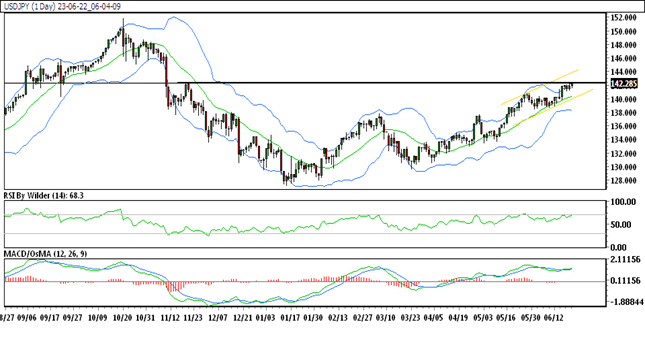
Trading in an Up Channel
Similar to the weekly chart, the daily chart of USD/JPY also shows the pair trading within an upward channel, reinforcing the bullish trend.
Maintaining Position Above SMA
USD/JPY remains above all Simple Moving Averages (SMA) on the daily chart. This indicates the continued strength of the bullish momentum.
Bullish Signals from RSI and Stochastic
The RSI on the daily chart remains in the buying zone, suggesting a bullish market sentiment. The Stochastic oscillator also indicates an upward trend, supporting the positive outlook for USD/JPY.
- Immediate support: 141.61
- Resistance level: 142.37
Trade Suggestion
After a significant plunge, USD/JPY formed a double bottom-like pattern on the daily chart and has since been following a higher-high trend. The pair has recently broken the previous day’s high and is currently trading near an important resistance level. If this resistance level is breached, further upside potential exists.
Trade Suggestion:
- Buy at 142.36
- Take Profit at 143.53
- Stop Loss at 141.42
Please conduct a thorough analysis and consider your risk tolerance before making any trading decisions.
Conclusion
USD/JPY exhibits promising technical signals on both the weekly and daily charts. The upward channels, along with the position above the SMAs, indicate a bullish bias. The RSI and Stochastic indicators support the positive outlook. Traders may consider the provided trade suggestion but should exercise caution and apply their own analysis before executing any trades.