

GERMAN BUND PRICE TECHNICAL ANALYSIS: WEEKLY CHART
In weekly chart German Bund is trading in down channel
German Bund is trading below all SMA
RSI is in buying zone which indicates bullishness. Stochastic suggests down trend.
Its immediate support is at 134.37 & the resistance level is at 135.65
The German Bund price attempted to increase, but it was rejected from a resistance zone. Now, the price has started moving upward once more and has broken the previous week’s high. The price is presently trading at a resistance zone; if it manages to break it, we can expect an upward trend.
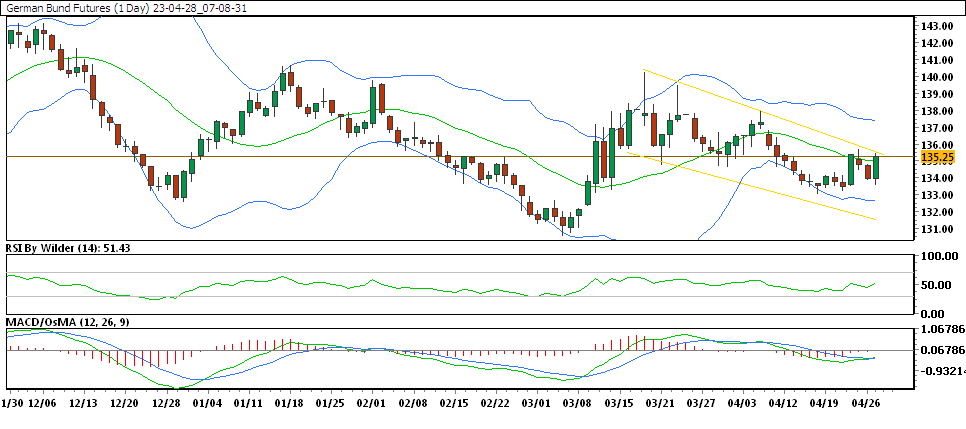
GERMAN BUND PRICE TECHNICAL ANALYSIS: DAILY CHART
In daily chart German Bund is trading in down channel.
German Bund is currently trading above all SMA.
RSI is in buying zone which indicates bullishness. Stochastic suggests up trend
Its immediate support is at 134.70 & immediate resistance is at 135.32
How to Trade German Bund this Week
The German Bund price attempted to increase, but it was rejected from a resistance zone. Now, the price has started moving upward once more and has broken the previous day high. The price is presently trading at a resistance zone; if it manages to break it, we can expect an upward trend.